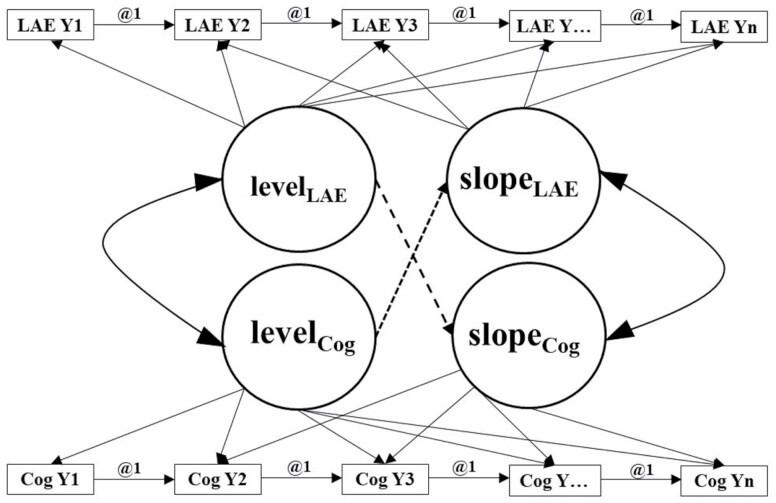
Figure 1.
Framework for the unconditional parallel process latent growth curve model. Notes: LAE = leisure activity engagement; Cog = cognitive performance; i = intercept; s = slope; Y = year. This figure represents an unconditional parallel process latent growth curve model that can test four hypotheses simultaneously. These four hypotheses are (a) concurrent relationship between initial cognitive performance and LAE, (b) initial cognitive performance predicting rates of change in LAE over the follow-up period, (c) initial LAE predicting rates of change in cognitive performance over the follow-up period, and (d) a dynamic, bidirectional relationship between cognitive performance and LAE over the follow-up period. The boxes indicate the assessments for both cognitive performance and LAE at each year from Year 1 to Year 7. The circles are the latent variables representing either LAE or cognitive performance at the initial level and slope or rate of change. The hypotheses correspond to the latent variables (circles) that are in the middle of the figure.

