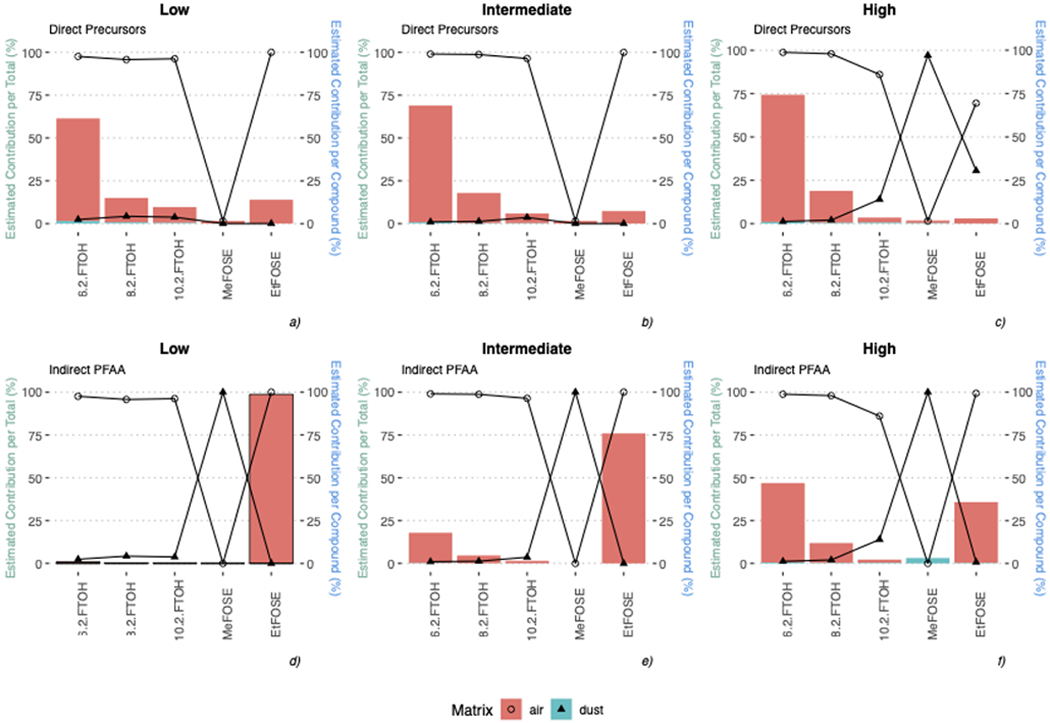
Figure 2. Percent of volatile and neutral PFAS (top panel) and indirect or biotransformed PFAA (bottom panel) intake via air inhalation (pink) and dust ingestion (blue) for children at ages 2 through 6.

Bars represent the relative contribution of individual precursors to total PFAS (left axis); bars are differentiated by color for both matrices. Lines represent the percent estimated contribution for each compound in air and dust (right axis). MeFOSE was detected at low concentrations in dust and <MDL in air.
