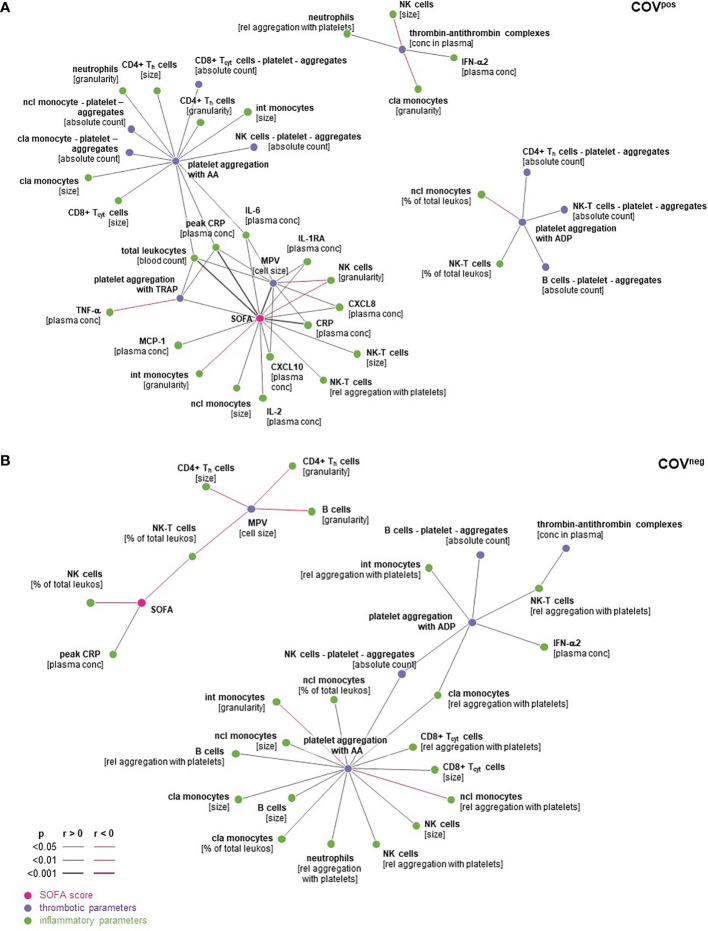
Figure 5.
Spearman’s correlations in COVpos (A) and COVneg (B) were expressed as dark grey lines if positively correlated and pink lines if correlated inversely. Correlations with p < 0.05 are depicted. cla Mo, classical monocytes; int Mo, intermediate monocytes; ncl Mo, nonclassical monocytes; Th, CD4pos helper T cells; Tcyt, CD8pos cytoxic T cells; NK-T, natural killer T cells; NK cells, natural killer cells; peak CRP, highest CPR level during hospital stay.

