. 2022 Mar 10;22(7):1286–1296. doi: 10.1039/d1lc00878a

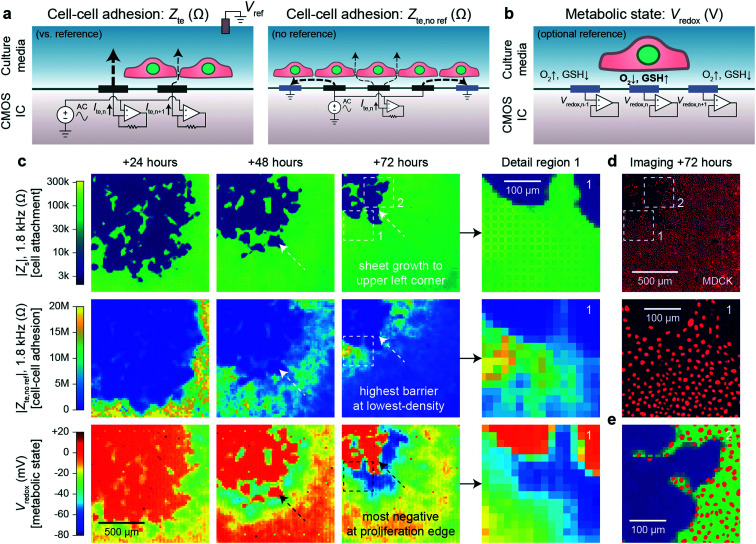
Fig. 3. Transepithelial impedance and extracellular redox mapping multi-parametric measurements for label-free, non-invasive cell culture monitoring. a, Transepithelial impedance, Zte, measurement schematics for cell–cell adhesion quantification. Measurements can be made versus a grounded reference (left) by applying an AC voltage to all electrodes with the each transepithelial electrode current, Ite,n (n = 1, 2, …4096), measured via transimpedance amplifiers (measurement duration of 1 s/frequency). The resultant field distribution is vertically aligned with the connectivity of the cells decreasing the Ite. A non-reference measurement can be made (right) by applying an AC voltage to an electrode (n) and its neighboring electrodes to create an effective vertical field measurement with the remainder of the electrodes' grounded. To generate a cell map, the applied signal is scanned across the array (40 s per scan/frequency). The Zte can be extracted from either measurement (ESI Discussion 1). b, Extracellular redox potential, Vredox, measurement schematic to measure the open circuit potential via the pixel amplifier configured as a buffer. c, Multi-parametric measurements of |Zs|, |Zte|, and Vredox at +24, +48, and +72 hours after MDCK cell plating to infer cell attachment (top), cell–cell adhesion (middle), and metabolic state (bottom). d, Nuclei fluorescence imaging at +72 hours after plating (top) and a detail region 1 comparison (bottom) show the lowest cell density on the leading edge in comparison to the trailing edge. e, A detail region 2 overlay of the cell nuclei and cell attachment shows good spatial correspondence with single-cell resolution.

Fig. 3