. 2022 Mar 10;22(7):1286–1296. doi: 10.1039/d1lc00878a

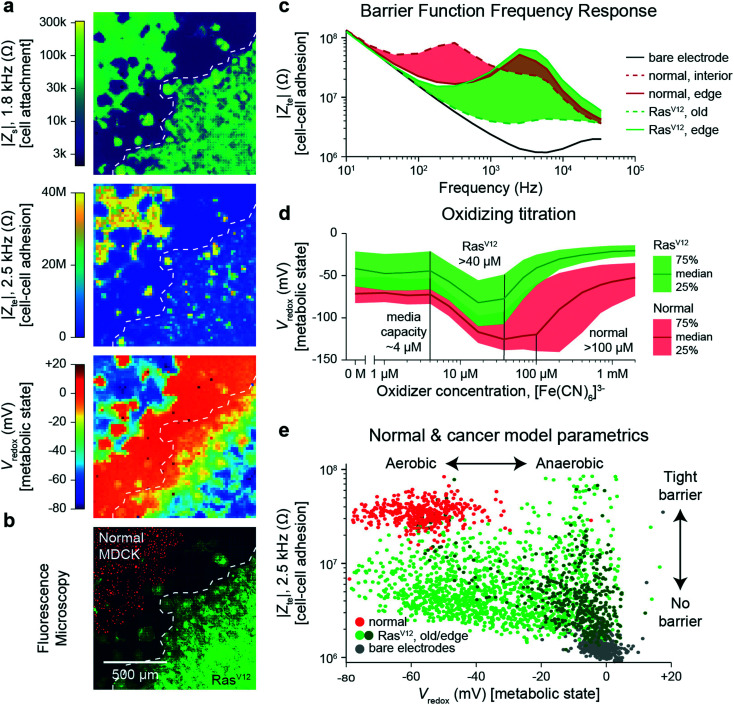
Fig. 4. Multi-parametric measurement of MDCK cells expressing the RasV12 oncogene showing decreased cell–cell connectivity and Warburg metabolism. a and b, Multi-parametric measurements of |Zs|, |Zte|, and Vredox with normal MDCK cells (red nuclei, upper left corner in b) and MDCK cells expressing the RasV12 oncogene (green membrane, lower right corner in b), to infer cell attachment (a, top), cell–cell adhesion (a, middle), and metabolic state (a, bottom). c, Cell–cell adhesion measurements across frequency for representative pixels for the leading edge and interior cells of both cell types. d, The normal and RasV12 cancer model MDCK cells show different characteristics during a ferricyanide, [Fe(CN)6]3−, oxidizing titration. A time-course of the titration is shown in Video S8. e, To highlight the parametric differences related to the RasV12 expression, a plot of the cell–cell adhesion and metabolic state shows distinct clustering of the normal MDCK (red) and old/edge RasV12 expressing MDCK (light/dark green) cells.

Fig. 4