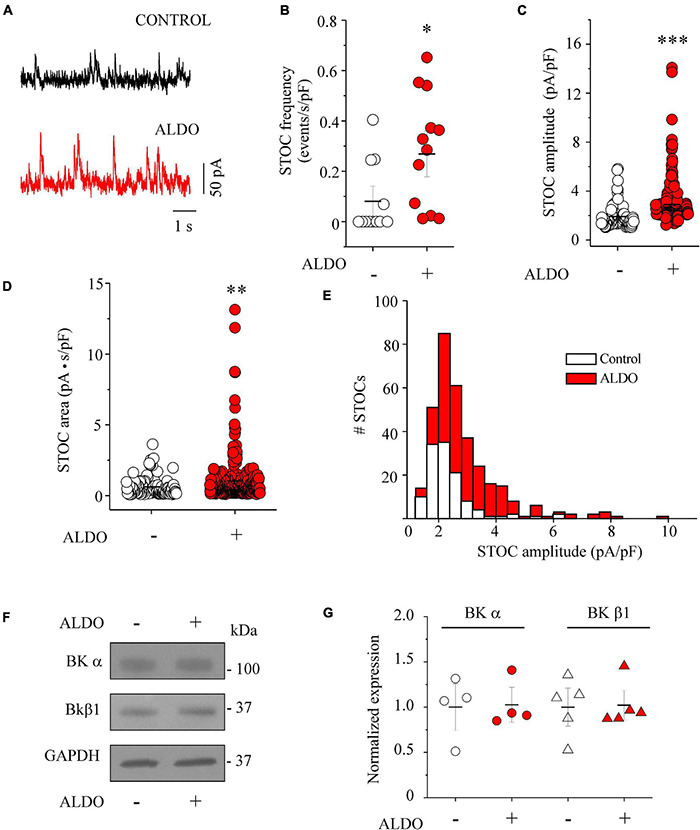
FIGURE 5.

Aldosterone treatment increases the frequency and the amplitude of STOCs in MASMCs without modifying BK channel subunit expression. (A) Representative traces of STOCs recorded at a holding potential of –40 mV from MASMCs in the absence (CONTROL, black trace) or after 24 h-treatment with aldosterone 10 nM (ALDO, red trace). Scatterplots with mean ± SEM illustrate STOC frequency (B, normalized with respect to cell capacitance, in events/s/pF), STOC amplitude (C, normalized with respect to cell capacitance, in pA/pF), and STOC area-under-the-curve (D, in pA.s) in control MASMCs (n = 119 events/n = 12 cells/N = 4 animals, empty circles) and ALDO-treated cells (n = 333 events/n = 12 cells/N = 5 animals, red circles). *P < 0.05, **P < 0.01, and ***P < 0.001 vs. control group. (E) Histogram distribution of normalized STOC amplitudes in control (n = 119 events/n = 12 cells/N = 4 rats, white bars) and ALDO-treated MASMCs (n = 333 events/n = 12 cells/N = 5 rats, red bars) indicates the increase in the amplitude of STOCs above 3.6 pA/pF in ALDO-treated cells. (F,G) Representative immunoblot images and scatterplot with mean ± SEM of BKCa channel α subunit expression (n = 4 control samples, empty circles; n = 4 ALDO-treated samples, red circles), and β1 subunit expression (n = 5 control samples, empty triangles; n = 5 ALDO-treated samples, red triangles). Each sample was prepared with a pool of 3–4 MA segments from three rats. Values were normalized with respect to GAPDH expression.
