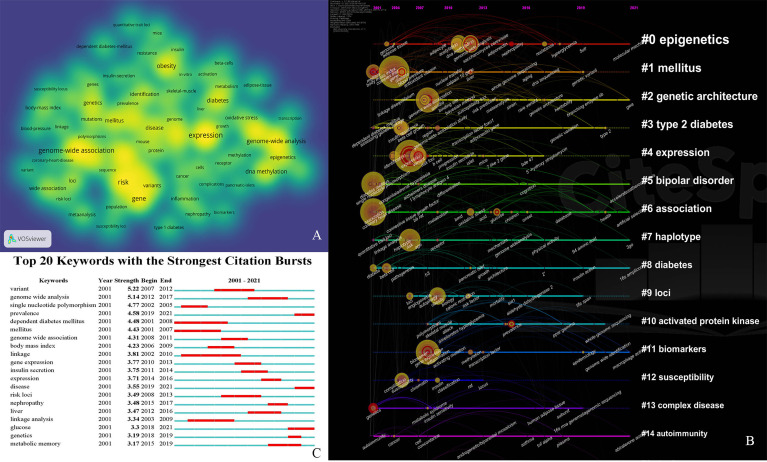
Figure 5.
(A) The co-occurrence network of the most frequently occurred 40 keywords in field of GWAS in diabetes. Node size refers to number of frequency. (B) Timeline view of cluster for keywords co-occurrence in pathfinder pruning. Each cluster is named by most frequently occurred keyword. The clusters were arranged vertically in the descending order of their size (the smallest number refers to the largest cluster). The position and size of the node on the timeline reveal the cumulative frequency, and the year for the first occurrence of each keyword, respectively. Nodes with red tree rings refer to keywords with citation bursts. (C) Top 20 keywords with the strongest citation bursts. The red bar refers to the burst duration. The burst strength indicates the importance of the keyword to the research field.

