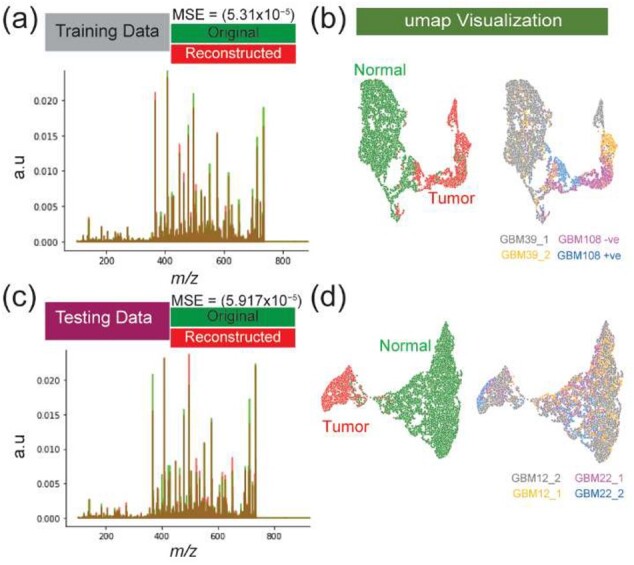
Fig. 3.

Performance of the VAE module and nonlinear data visualization: overlay of the TIC-normalized average spectrum of original and reconstructed data for both training (a) and testing (b) datasets. UMAP visualization of the five-dimensional latent variable captured by the VAE model reveals distinction between normal and tumor mass spectra from different GBM models for both training (b) and testing (d) dataset
