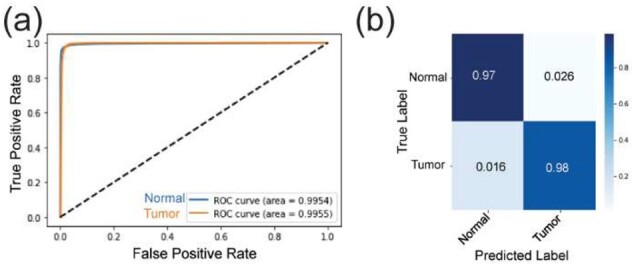
Fig. 4.

Classification performance on the MALDI FT-ICR MSI test set: (a) ROC curve distribution for both normal (blue) and tumor (orange) classes with an AUC of 99.54% and 99.55%, respectively. (b) Confusion matrix showing the prediction performance compared to the ground truth labels
