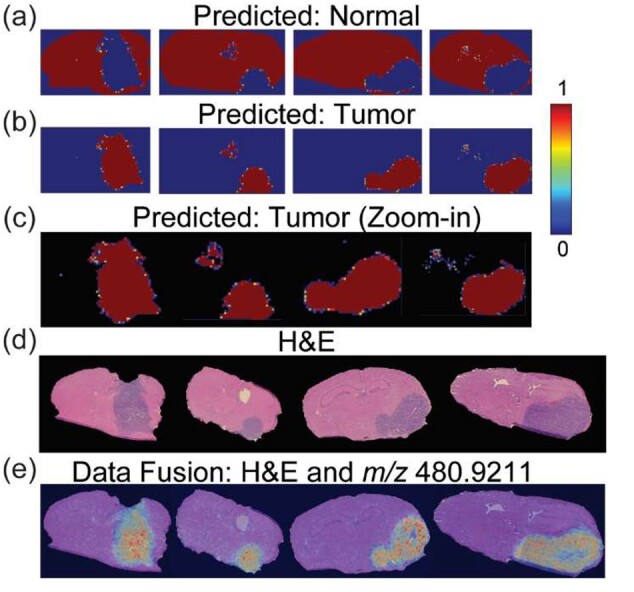
Fig. 5.

Spatial mapping of the classification predictions and multimodal integration: spatial distribution of the spectral-wise probabilistic predictions for normal (a) and tumor (b) classes. (c) Closeup visualization of the spatially mapped tumor prediction scores reveals a higher level of uncertainty at the interface between normal and tumor (i.e. tumor margins). (d) The H&E microscopy images show tumor regions in different GBM models (columns). (e) Multimodal integration of the H&E images and ion image at m/z 480.9211 ± 0.01 which is highly correlated and elevated in the tumor region
