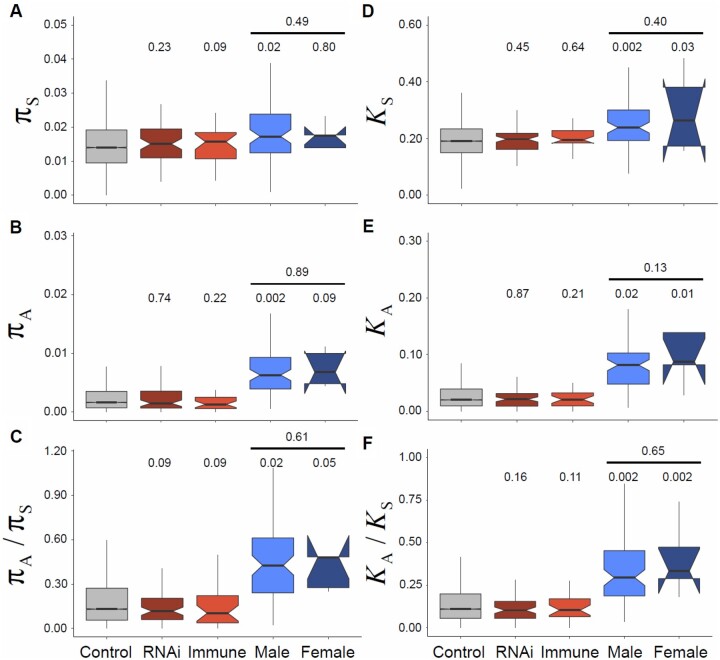
Fig. 2.
Diversity and divergence, as measured by π (left: A, B, C) and K (right: D, E, F), for synonymous sites (πS and KS in A and D), nonsynonymous sites (πA and KA in B and E), and the ratio of synonymous and nonsynonymous sites (πA/πS and KA/KS in C and F), respectively. Diversity and divergence measures are given for each gene class (see main text for explanation), including Control, which is an aggregate of all other genes not included in a subgene class. P values represent tests against “control” genes, with an additional test for the difference between male and female-biased genes. Note that the very small sample size leads to the confidence “notch” for the median of female-biased genes being wider than the inter-quartile range.

