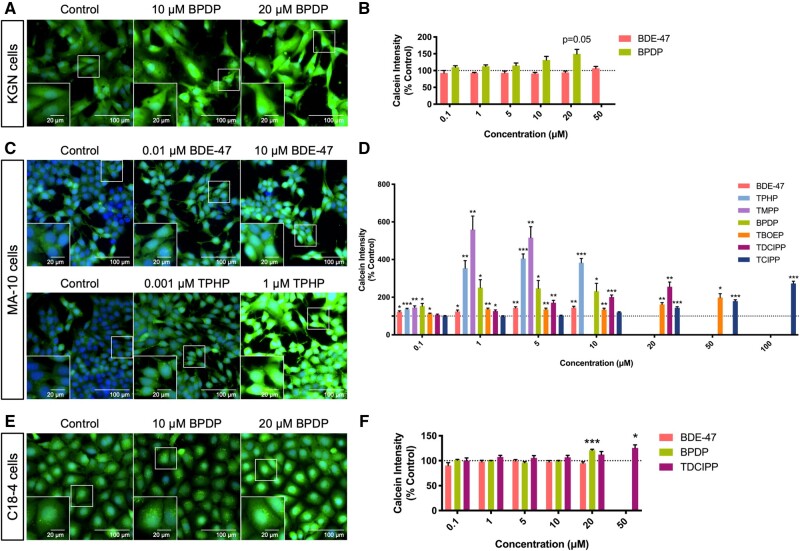
Figure 2.
Effects of organophosphate esters (OPEs) and 2,2′,4,4′-tetrabromodiphenyl ether (BDE-47) on Calcein-AM staining intensity in KGN granulosa cells (A and B), MA-10 mouse Leydig cells (C and D), and C18-4 mouse spermatogonial cells (E and F). Cells were stained by Hoechst 33342 (blue, stains nuclei) and Calcein-AM (green, an indicator of cell viability) fluorescent dyes for 30 min and visualized by high-content imaging (40× magnification). Scale bars of the insets and the main images denote 20 and 100 μm, respectively. Bar graphs show the quantification of Calcein-AM staining intensity following 48 h BDE-47 or OPE exposures. Data are shown as percentages relative to controls; values represent means ± SEM; n = 6–8. One-sample Holm-Bonferroni-corrected t tests were conducted to determine significant differences from controls (=100): *p < .05, **p < .01, and ***p < .001. For ease of visualization, only OPEs with significant findings at one or more treatment concentrations are shown, data for concentrations from 0.1 to 50 or 100 μM are shown. Concentrations that induced > 30% cell death were excluded from the analyses.

