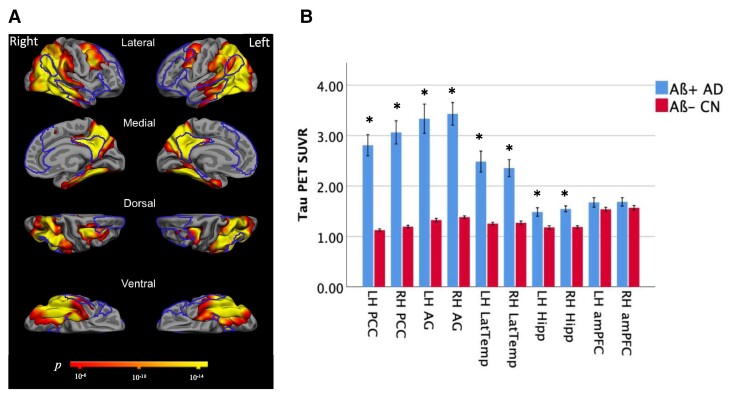
Figure 2.
Mean tau PET signal is high across the posterior DMN in Aβ+ Alzheimer’s disease. (A) Maps of the mean cortical tau (18F-AV-1451) PET in 25 Aβ+ Alzheimer’s disease patients compared with 25 Aβ− CN participants, with significance thresholded at P < 10−6. The DMN is outlined. (B) Mean partial volume-corrected tau PET SUVR values in ROIs comprising the DMN were compared between the Aβ+ Alzheimer’s disease patients and Aβ− CN group with independent samples t-tests. Elevated tau signal in the left (t = 8.0, P = 2.5 × 10⁻¹⁰) and right (t = 8.1, P = 1.7 × 10⁻¹⁰) PCC, left (t = 6.9, P = 1.2 × 10⁻⁸) and right (t = 9.05, P = 6.0 × 10⁻¹²) AG, left (t = 5.9, P = 4.2 × 10⁻⁷) and right (t = 6.3, P = 7.6 × 10⁻⁸) LTC and left (t = 3.4, P = 0.001) and right (t = 5.6, P = 9.2 × 10⁻⁷) hippocampal formation were observed in the Aβ+ Alzheimer’s disease patients compared with Aβ− CN participants. PCC, posterior cingulate cortex; AG, angular gyrus; LatTemp, lateral temporal cortex; Hipp, hippocampus; LH, left hemisphere; RH, right hemisphere. *Significant group difference at the level of P < 0.005. There were no group differences in tau PET SUVR values in the left and right amPFC. SUVR, standard uptake value ratio; ROI, region of interest.

