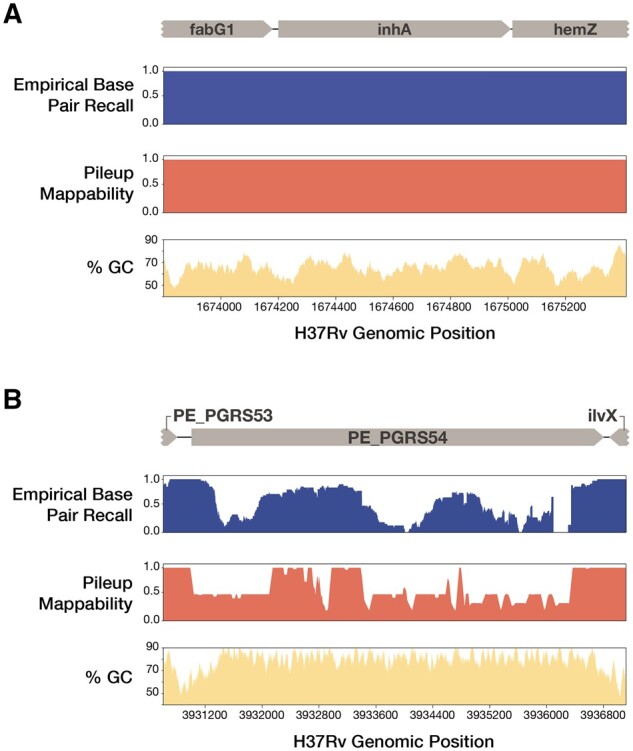
Fig. 2.

EBR, pileup mappability and GC content across two example regions of the H37Rv genome. EBR, pileup mappability (K = 50 bp, e = 4 mismatches) and GC% (100 bp window) values are plotted across all base pair positions of two regions of interest. (A) InhA, an antibiotic resistance gene, shows perfect EBR across the entire gene body. (B) In contrast, PE_PGRS54, a known highly repetitive gene with high GC content, has extremely low EBR across the entire gene body. Browser tracks of EBR and pileup mappability in BEDGRAPH format are made available as supplementary Files 17 and 18
