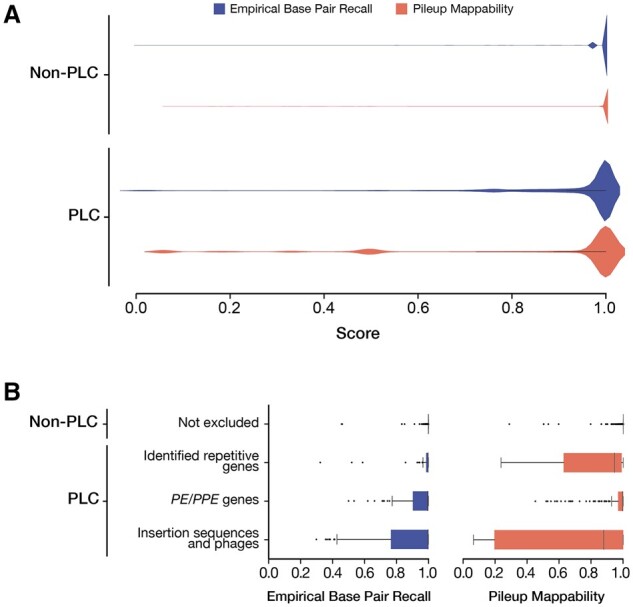
Fig. 4.

Distribution of EBR and pileup mappability scores in PLC and non-PLC regions. (A) Comparison of the base-level distribution of EBR and pileup mappability (P-Map, K = 50, E = 4) scores of PLC and non-PLC regions. (B) The distribution of gene-level mean EBR and P-Map (K = 50, E = 4) between PLC and non-PLC regions. The pe and ppe gene families (PE/PPEs) and MGEs, which make up 82% of PLC genes, demonstrated significantly lower mean EBR and pileup mappability than other non-PLC genes
