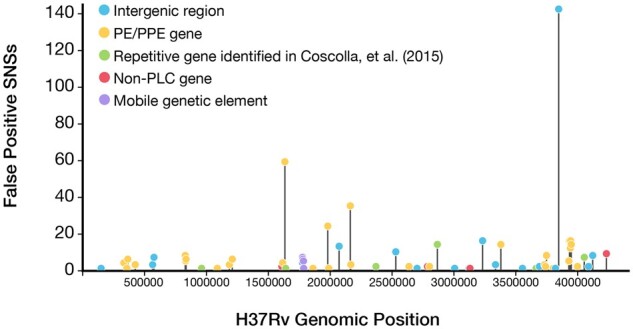
Fig. 5.

The distribution of potential false positive SNS calls across all genomic regions of the H37Rv genome. The frequency of false positive SNS calls detected (MQ ≥ 30) across all 36 isolates evaluated was plotted for all regions of the H37Rv genome (gene or intergenic regions). The top 30 regions ranked by the number of total false positives contained 89.4% (490/548) of the total false positive SNSs and spanned only 65 kb of the H37Rv genome. Full results for all annotated genomic regions (gene or intergenic) can be found in Supplementary File S9
