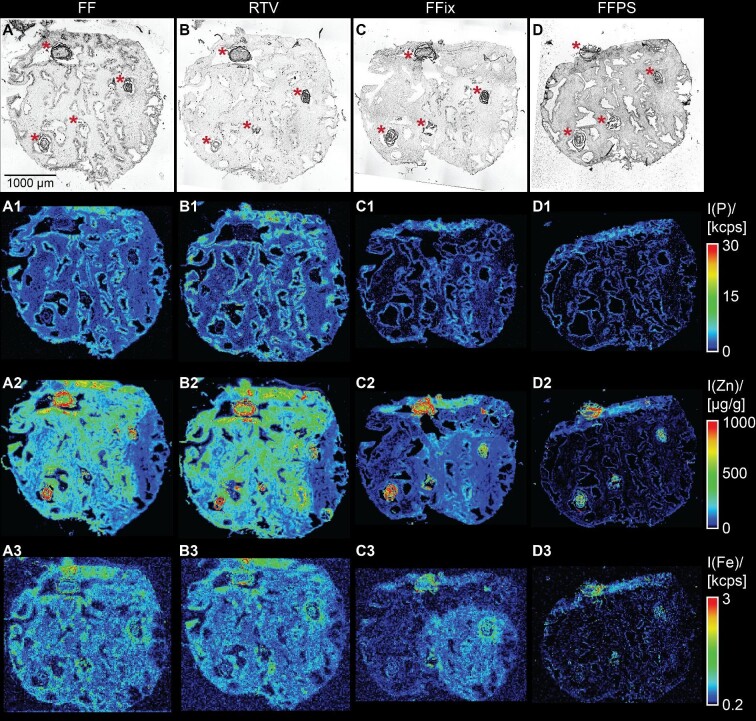
Fig. 3.
Phosphorous, zinc, and iron distributions after using the four different tissue preparation and storage protocols 1–4 presented in Fig. 1 (replicate set A). Shown are bright-field microscopic images (AD) and pseudo color images of the qualitative phosphorous (A1–D1), iron (A3–D3), and quantitative zinc (A2–D2) distributions as obtained by laser ablation-inductively coupled plasma-mass spectrometry imaging (LA–ICP–MSI). Images are of serial sections of the same tissue sample, which were preserved, stored, and shipped according to the FF (A), RTV (B), FFix (C), and FFPS (D) protocols. Calibration for zinc was performed using matrix-matched standards based on gelatin. Zinc hotspot areas are marked with asterisks in the bright-field microscopic images. (FF = fresh frozen, RTV = room temperature vacuum dried and sealed, FFix = formalin fixed, FFPS = formalin fixed, paraffin sealed).

