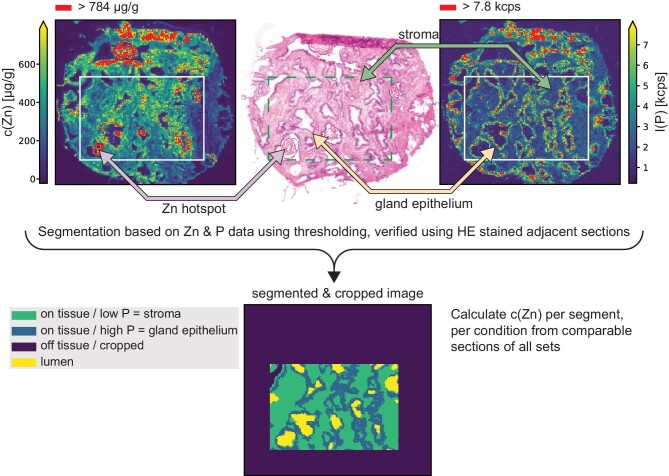
Fig. 5.
Segmentation of MSI data was based on zinc (top left) and phosphorous (top right) data by thresholding and verification using adjacent hematoxylin, eosin, and saffron (HES) stained sections (top middle, features indicated by arrows). As position and morphology slightly changed between the consecutive sections, all MS images were cropped to equally sized smaller images covering roughly the same area of the original sample to increase comparability (indicated with white boxes on Zn and P distribution images and as a dashed green box on the HES image). Cropped images were segmented based on the P contrast and distribution into on tissue/low P = stroma, on tissue/high P = gland epithelium, lumen, and off tissue.

