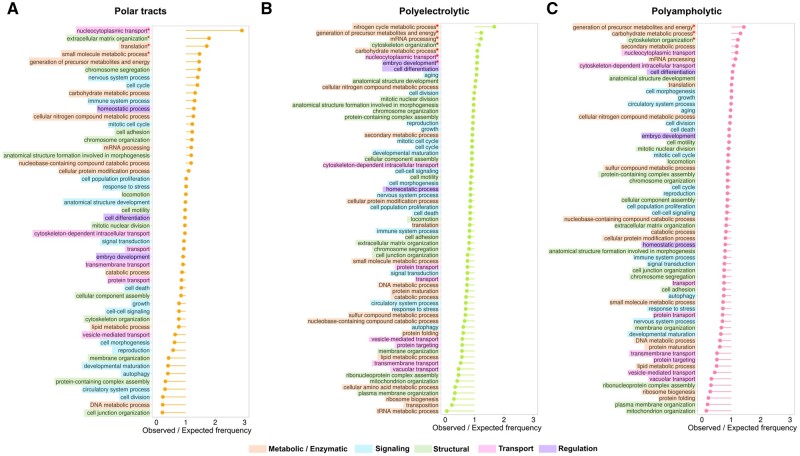
Fig. 5.
The ratio of observed and expected frequencies of BPs from GO generic subset defines overrepresented (ratio > 1) and underrepresented (ratio < 1) process categories for (A) polar tracts, (B) polyelectrolytic IDRs, (C) polyampholytic IDRs. Asterisks denote significant values according to chi-square test (P < 0.0001)

