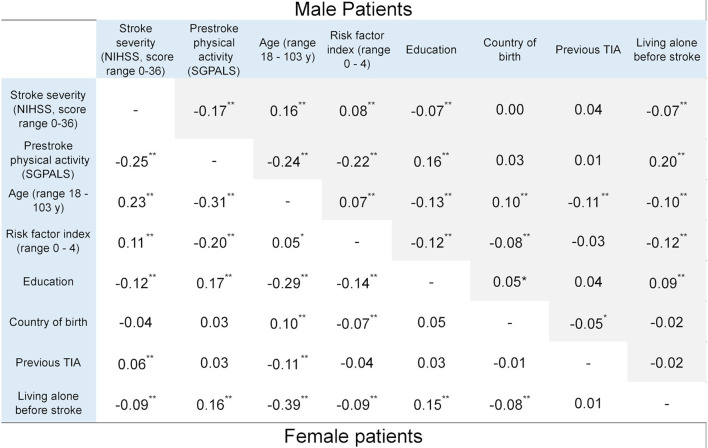
Figure 2.
Correlation coefficients between explanatory variables and the outcome variable, stratified by sex (*p < 0.05 and **p < 0.01). Statistics: phi correlation coefficient for binary variables and Spearman correlation coefficient for ordinal variables. NIHSS, national institutes of health stroke scale; SGPALS, saltin-grimby physical activity level scale (range 1–4; 1 is physically inactive); TIA, transient ischemic attack.

