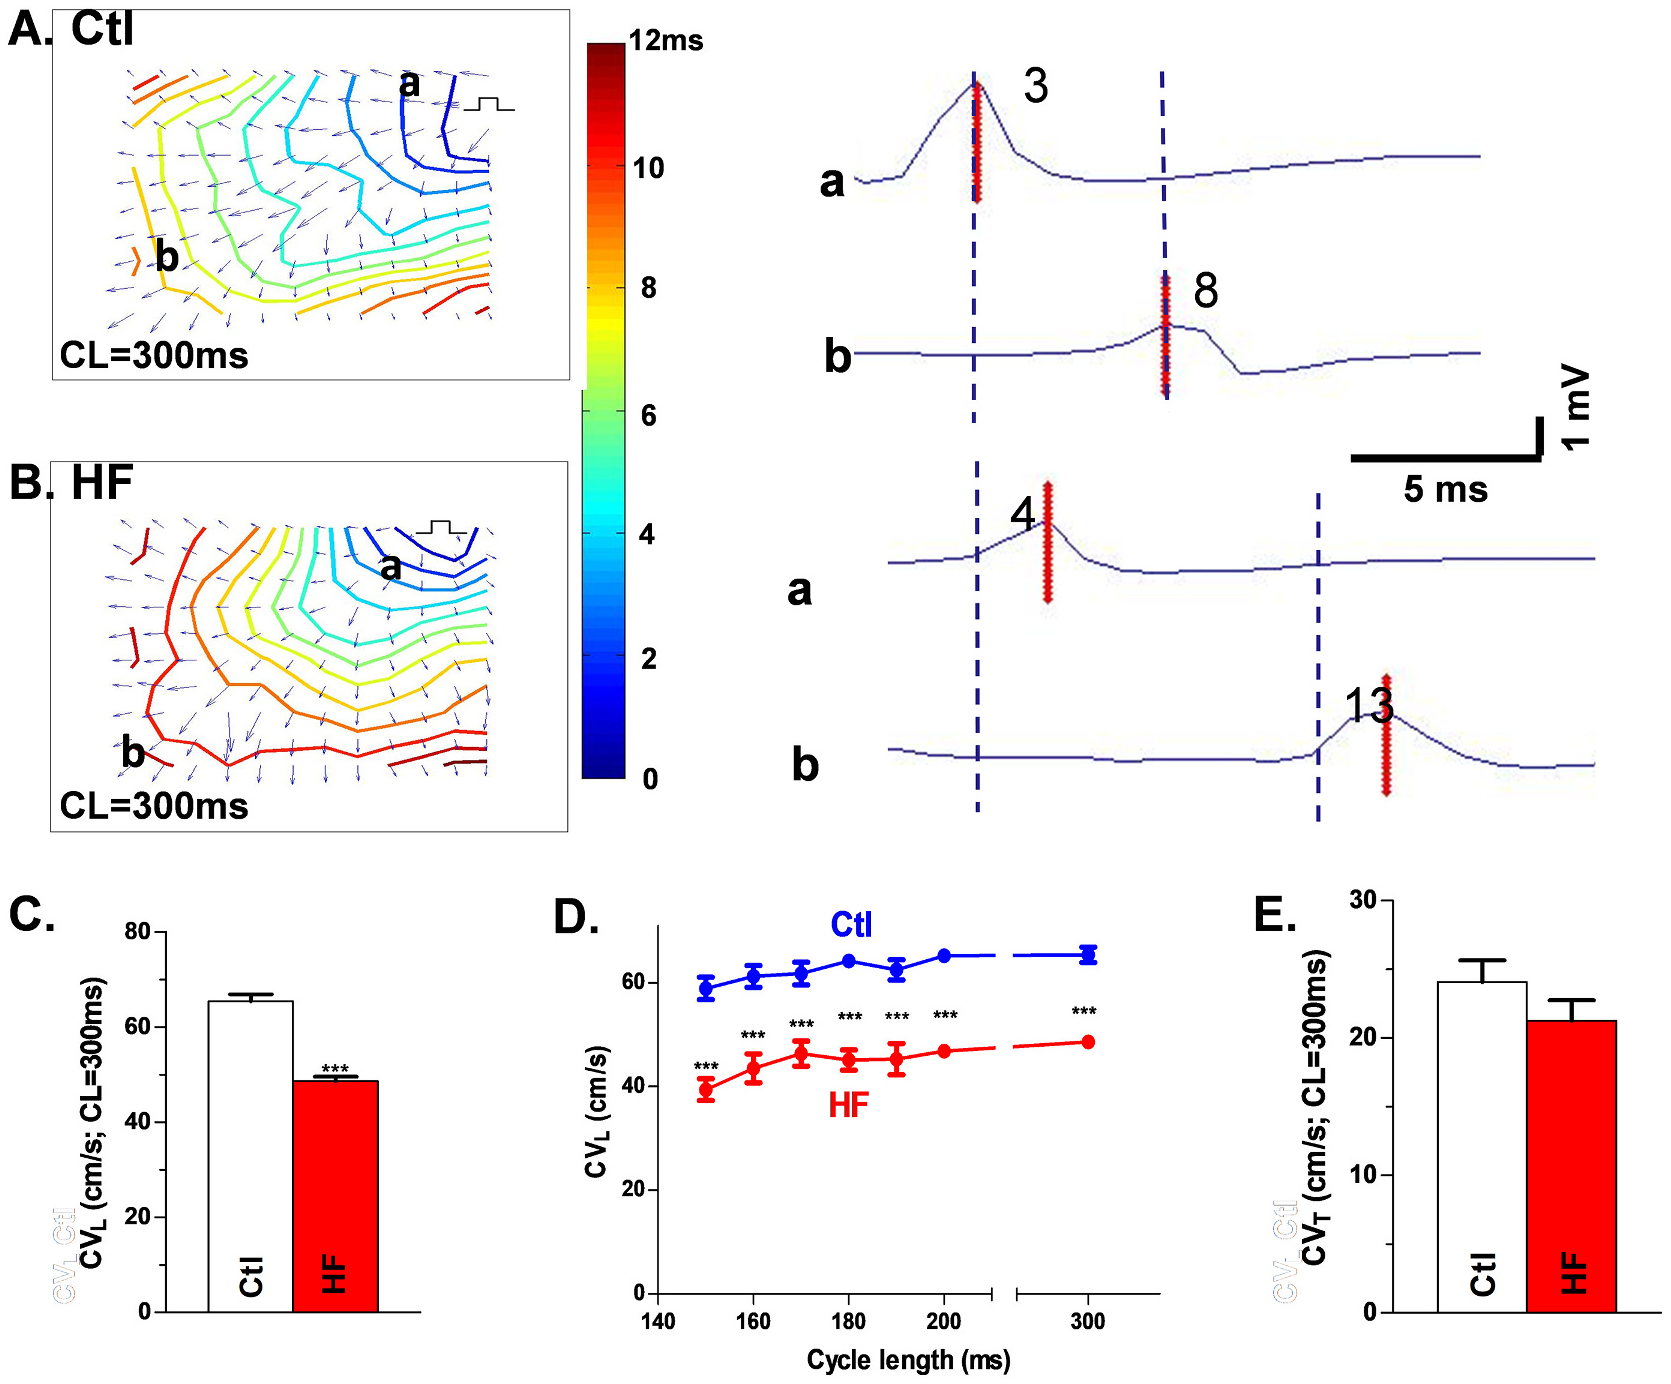
Fig. 3.

Slow conduction in HF LV. Isochronal maps with CV vector from each recording site for Ctl (A) and HF (B) tissue under drive train (A&B, left). Isochronal maps A and B show labeled recording sites a and b in the direction of CVL with electrograms from sites a and b (and the peak of the bipolar electrograms) at those respective sites (A&B, right), showing slow CVL in HF. Summary data for CVL with drive train stimuli (C) or with premature stimulation (D) and unchanged CVT (E). Nanimal = 9,8, ***p < 0.001. Each data point is the mean value from three technical repeats. Each error bar indicates the standard error of the mean (SEM) of each experimental group. Mann-Whitney test was used to compare the difference between the two groups. Abbreviations: control (Ctl), conduction velocity (CV), longitudinal conduction velocity (CVL), transverse conduction velocity (CVT), heart failure (HF).
