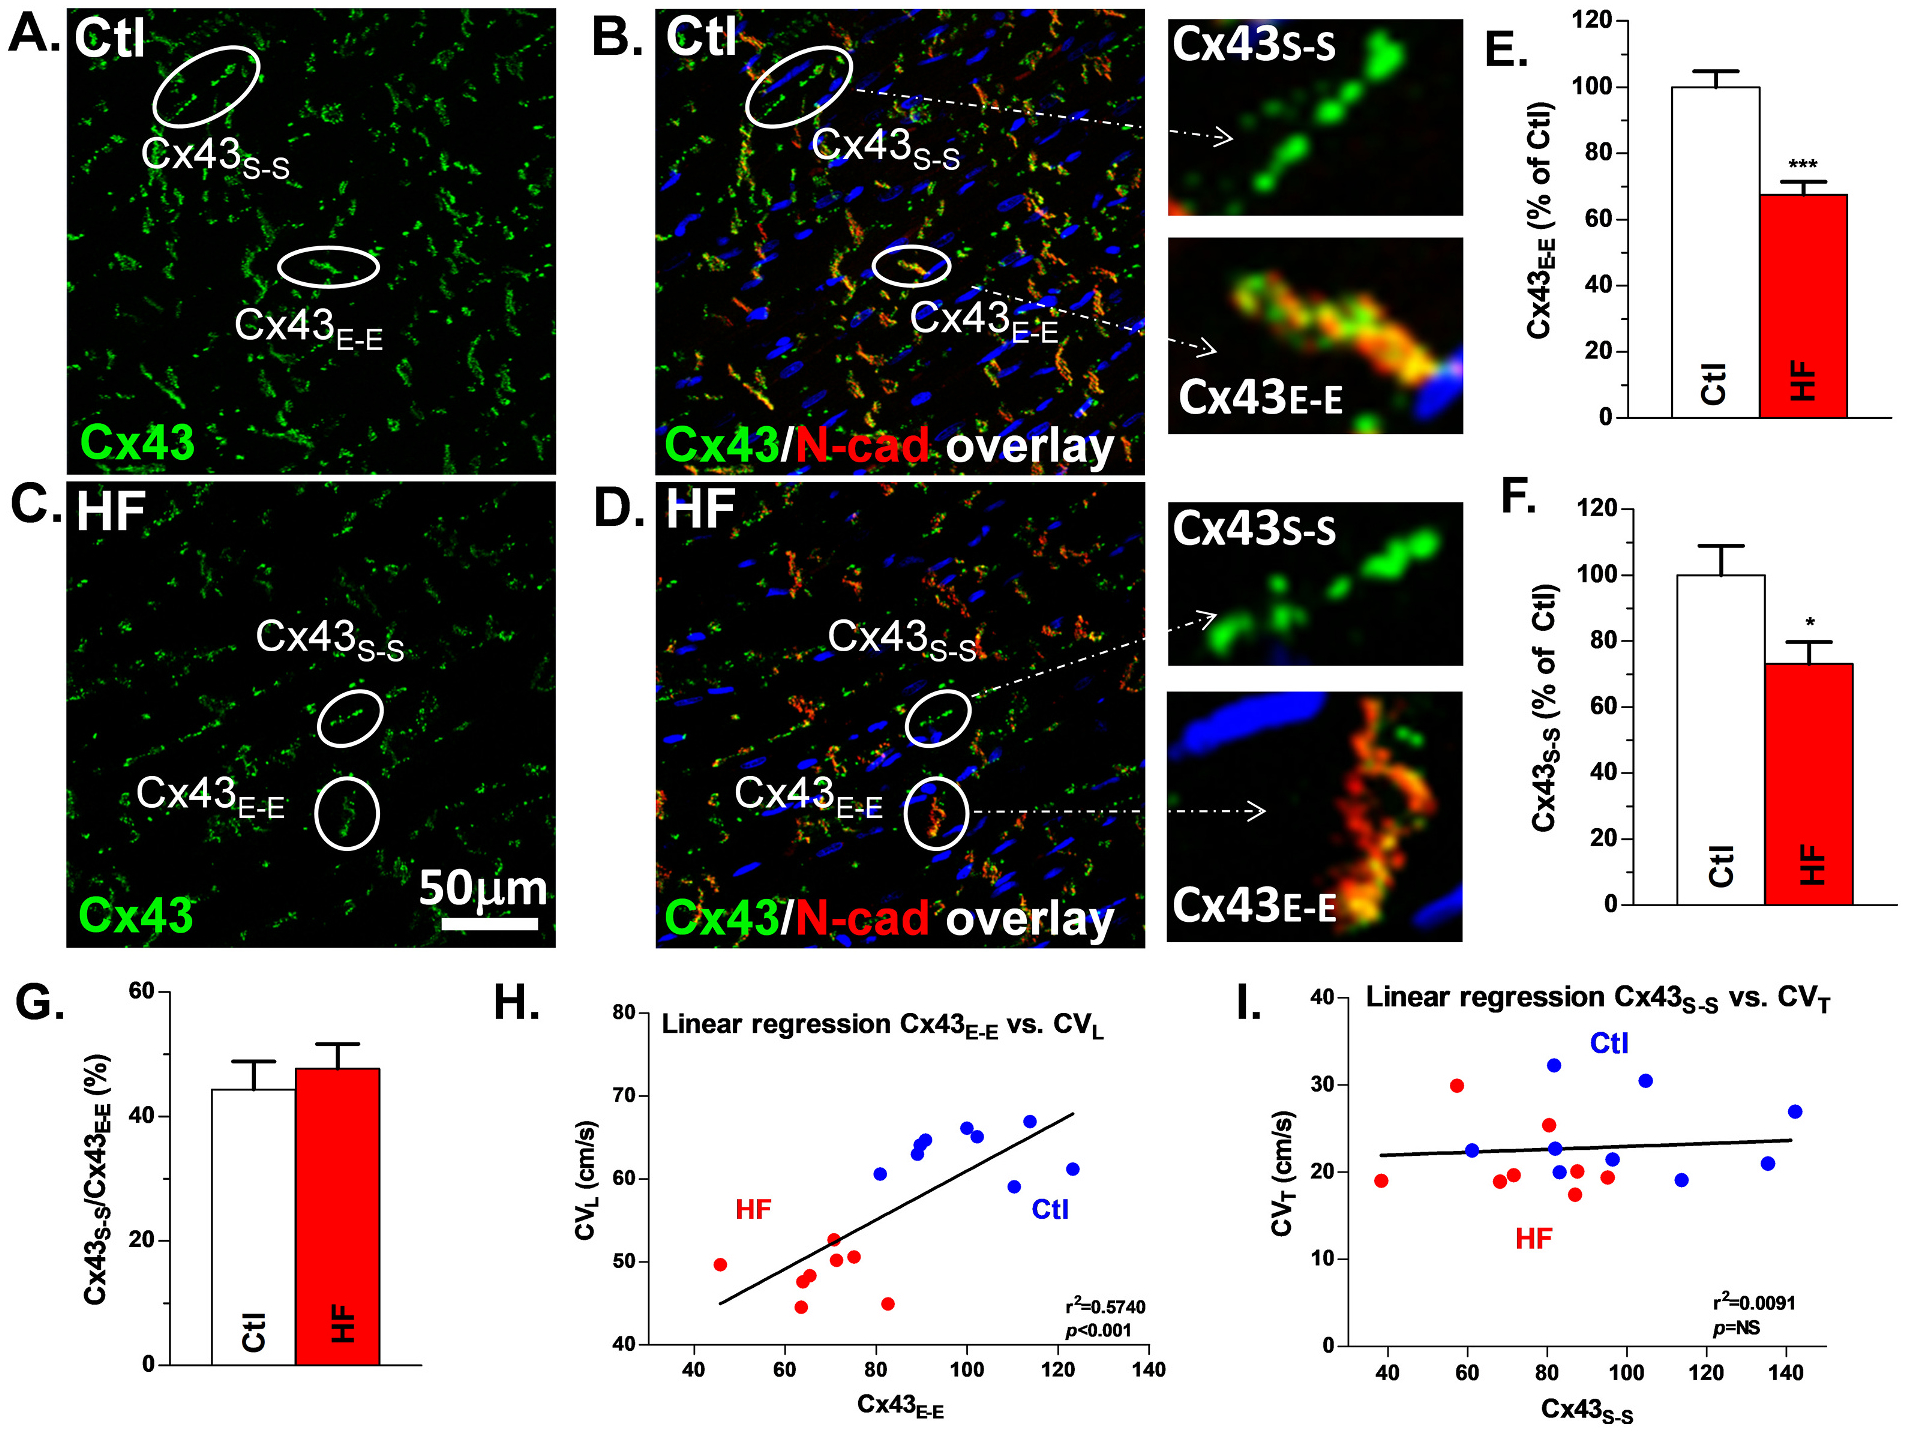
Fig. 5.

Reduced Cx43-T is positively correlated with slowed CVL in HF LV: Confocal images of Cx43 + N-cadherin double staining and Cx43 staining in Ctl (A, B) and HF (C, D) dog tissue used in grid mapping with Cx43 (green), N-cadherin (red) and overlap (yellow). Examples of Cx43E-E and Cx43S-S are encircled and labeled in each of the images as well as enlarged images of Cx43E-E and Cx43S-S. Quantification of Cx43E-E (E), Cx43S-S (F), and lateralization ratio (G) for HF vs Ctl, Nanimal = 9,8. Linear regression of Cx43E-E and CVL (H) and Cx43S-S and CVT (I), Nanimal = 9,8. *p < 0.05; ***p < 0.001. Each quantitative immunostaining Cx43 data point (Cx43E-E or Cx43S-S) is the mean value from forty confocal images of each tissue section. Each error bar indicates the standard error of the mean (SEM) of each experimental group. Mann-Whitney test was used to compare the difference between the two groups. Abbreviations: control (Ctl), longitudinal conduction velocity (CVL), heart failure (HF), junctional Cx43 (Cx43E-E), non-junctional Cx43 (Cx43S-S).
