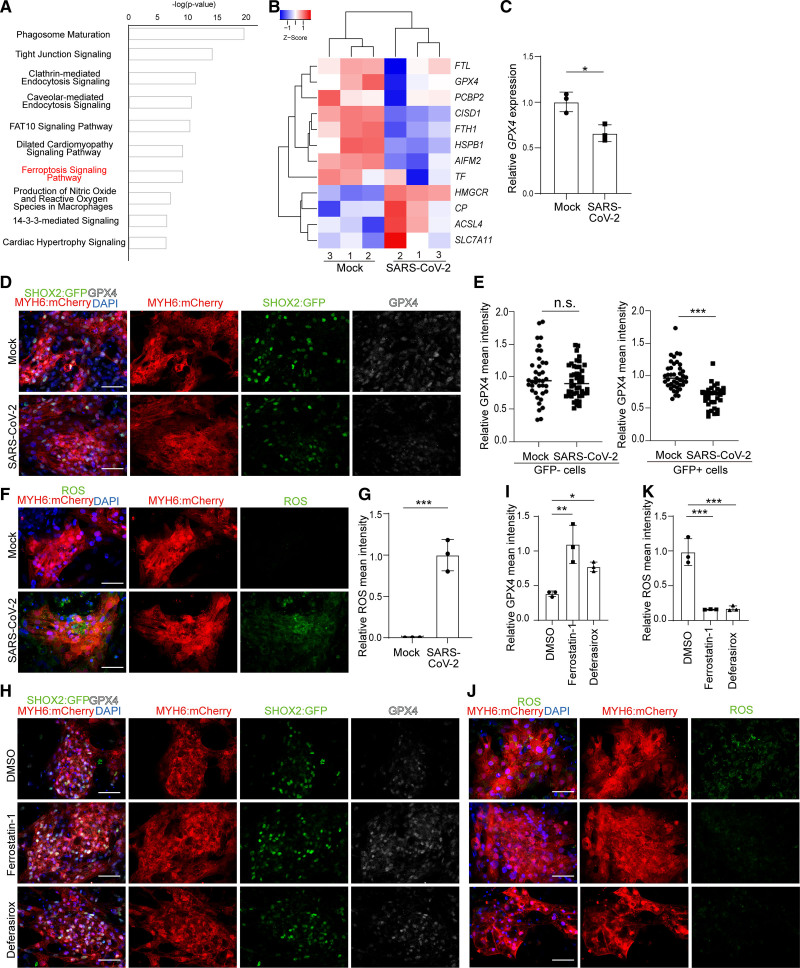
Figure 5.
Severe acute respiratory syndrome coronavirus 2 (SARS-CoV-2) infection causes sinoatrial node (SAN)–like pacemaker cell ferroptosis. A, Ingenuity Pathway Analysis of differential gene expression in mock vs SARS-CoV-2–infected human embryonic stem cell (hESC)–SAN–like pacemaker cells at 24 h postinfection (hpi; multiplicity of infection [MOI]=0.1). B, Heatmap comparing expression levels of ferroptosis related genes in mock vs SARS-CoV-2–infected hESC-SAN–like pacemaker cells at 24 hpi (MOI=0.1). The high Z score indicates high gene expression level. C, Quantitative real-time polymerase chain reaction analysis comparing GPX4 gene expression levels in mock or SARS-CoV-2–infected hESC-SAN–like pacemaker cells at 24 hpi (MOI=0.1). The graph represents the relative GPX4 (glutathione peroxidase 4) level normalized to ACTB. D and E, Immunostaining (D) and quantification (E) of GPX4 protein expression levels in mock or SARS-CoV-2–infected SHOX2:GFP- (short stature homeobox 2: green fluorescent protein) or SHOX2:GFP+ hESC-SAN–like pacemaker cells at 24 hpi (MOI=0.1). Scale bar=50 μm. Each dot in the graph represents the relative GPX4 level for individual SHOX2:GFP+ or SHOX2:GFP- cells. F and G, Immunostaining (F) and quantification (G) of reactive oxygen species (ROS) in mock and SARS-CoV-2–infected hESC-SAN–like pacemaker cells at 24 hpi (MOI=0.1). Scale bar=50 μm. H and I, Immunostaining (H) and quantification (I) of GPX4 protein expression level in dimethyl sulfoxide (DMSO), 10 μM ferrostatin-1 or 50 μM deferasirox-treated hESC-SAN–like pacemaker cells at 24 hpi with SARS-CoV-2 (MOI=0.1). Scale bar=50 μm. J and K, Immunostaining (J) and quantification (K) of ROS in DMSO, 10 μM ferrostatin-1 or 50 μM deferasirox-treated hESC-SAN–like pacemaker cells at 24 hpi with SARS-CoV-2 (MOI=0.1). Scale bar=50 μm. N=3 independent experiments. Data are presented as mean±SD. DAPI indicates 4′,6-diamidino-2-phenylindole; FAT10, human leukocyte antigen (HLA)-F adjacent transcript 10; and MYH6: mCherry, myosin heavy chain 6: mcherry. For comparison of 2 groups, P values were calculated by unpaired 2-tailed Student t test. For comparison of 3 groups, P values were calculated by 1-way ANOVA with an indicated control. n.s indicates no significance, *P<0.05, **P<0.01, ***P<0.001.

