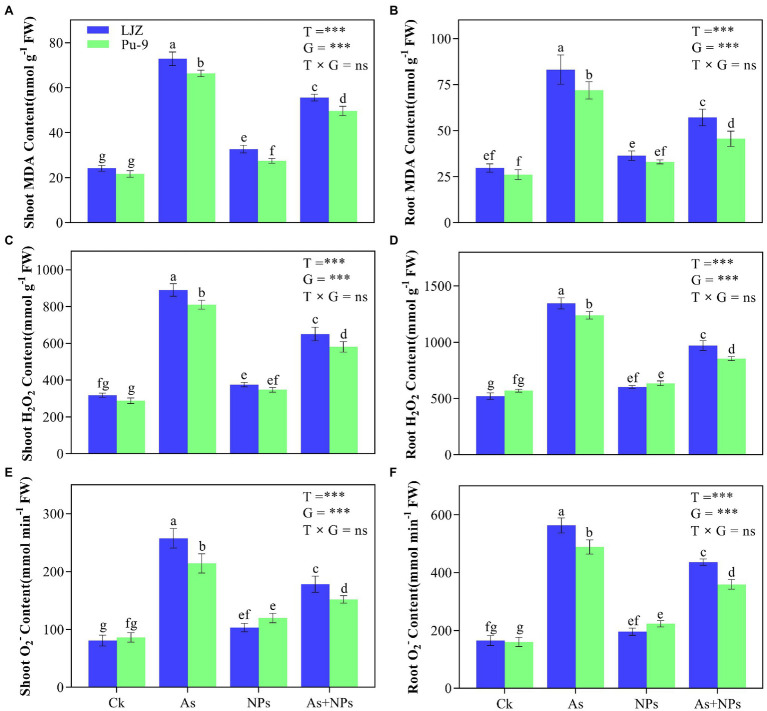
Figure 3.
Effects of the different treatments on MDA and ROS (H2O2 and ) contents. (A,B) MDA content in shoots and roots; (C,D) H2O2 content in shoots and root; (E,F) content in shoots and roots. Vertical bars represent the mean ± SD of four replicates. Different letters above error bars indicate the significant difference between treatments and genotypes at p ≤ 0.05. T, treatment; G, genotype; T × G, the interaction between treatment and genotype.

