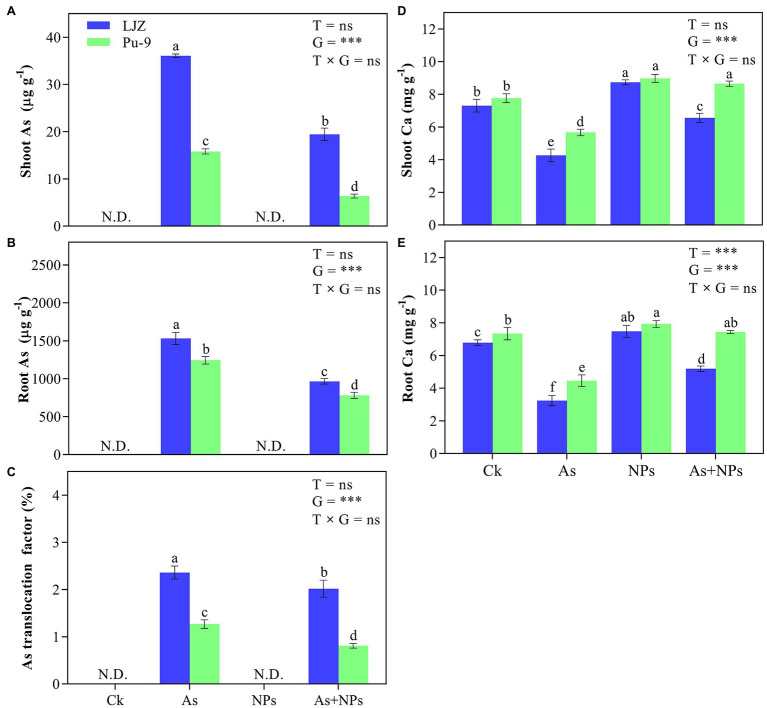
Figure 6.
Effects of the different treatments on Ca, As contents, and translocation factor in barley tissues. (A, B) As content in shoots and roots; (C) translocation factor; (D, E) Ca content in shoots nd roots. Different letters above error bars indicate the significant difference between treatments and genotypes at p ≤ 0.05. T, treatment; G, genotype; T × G, the interaction between treatment and genotype.

