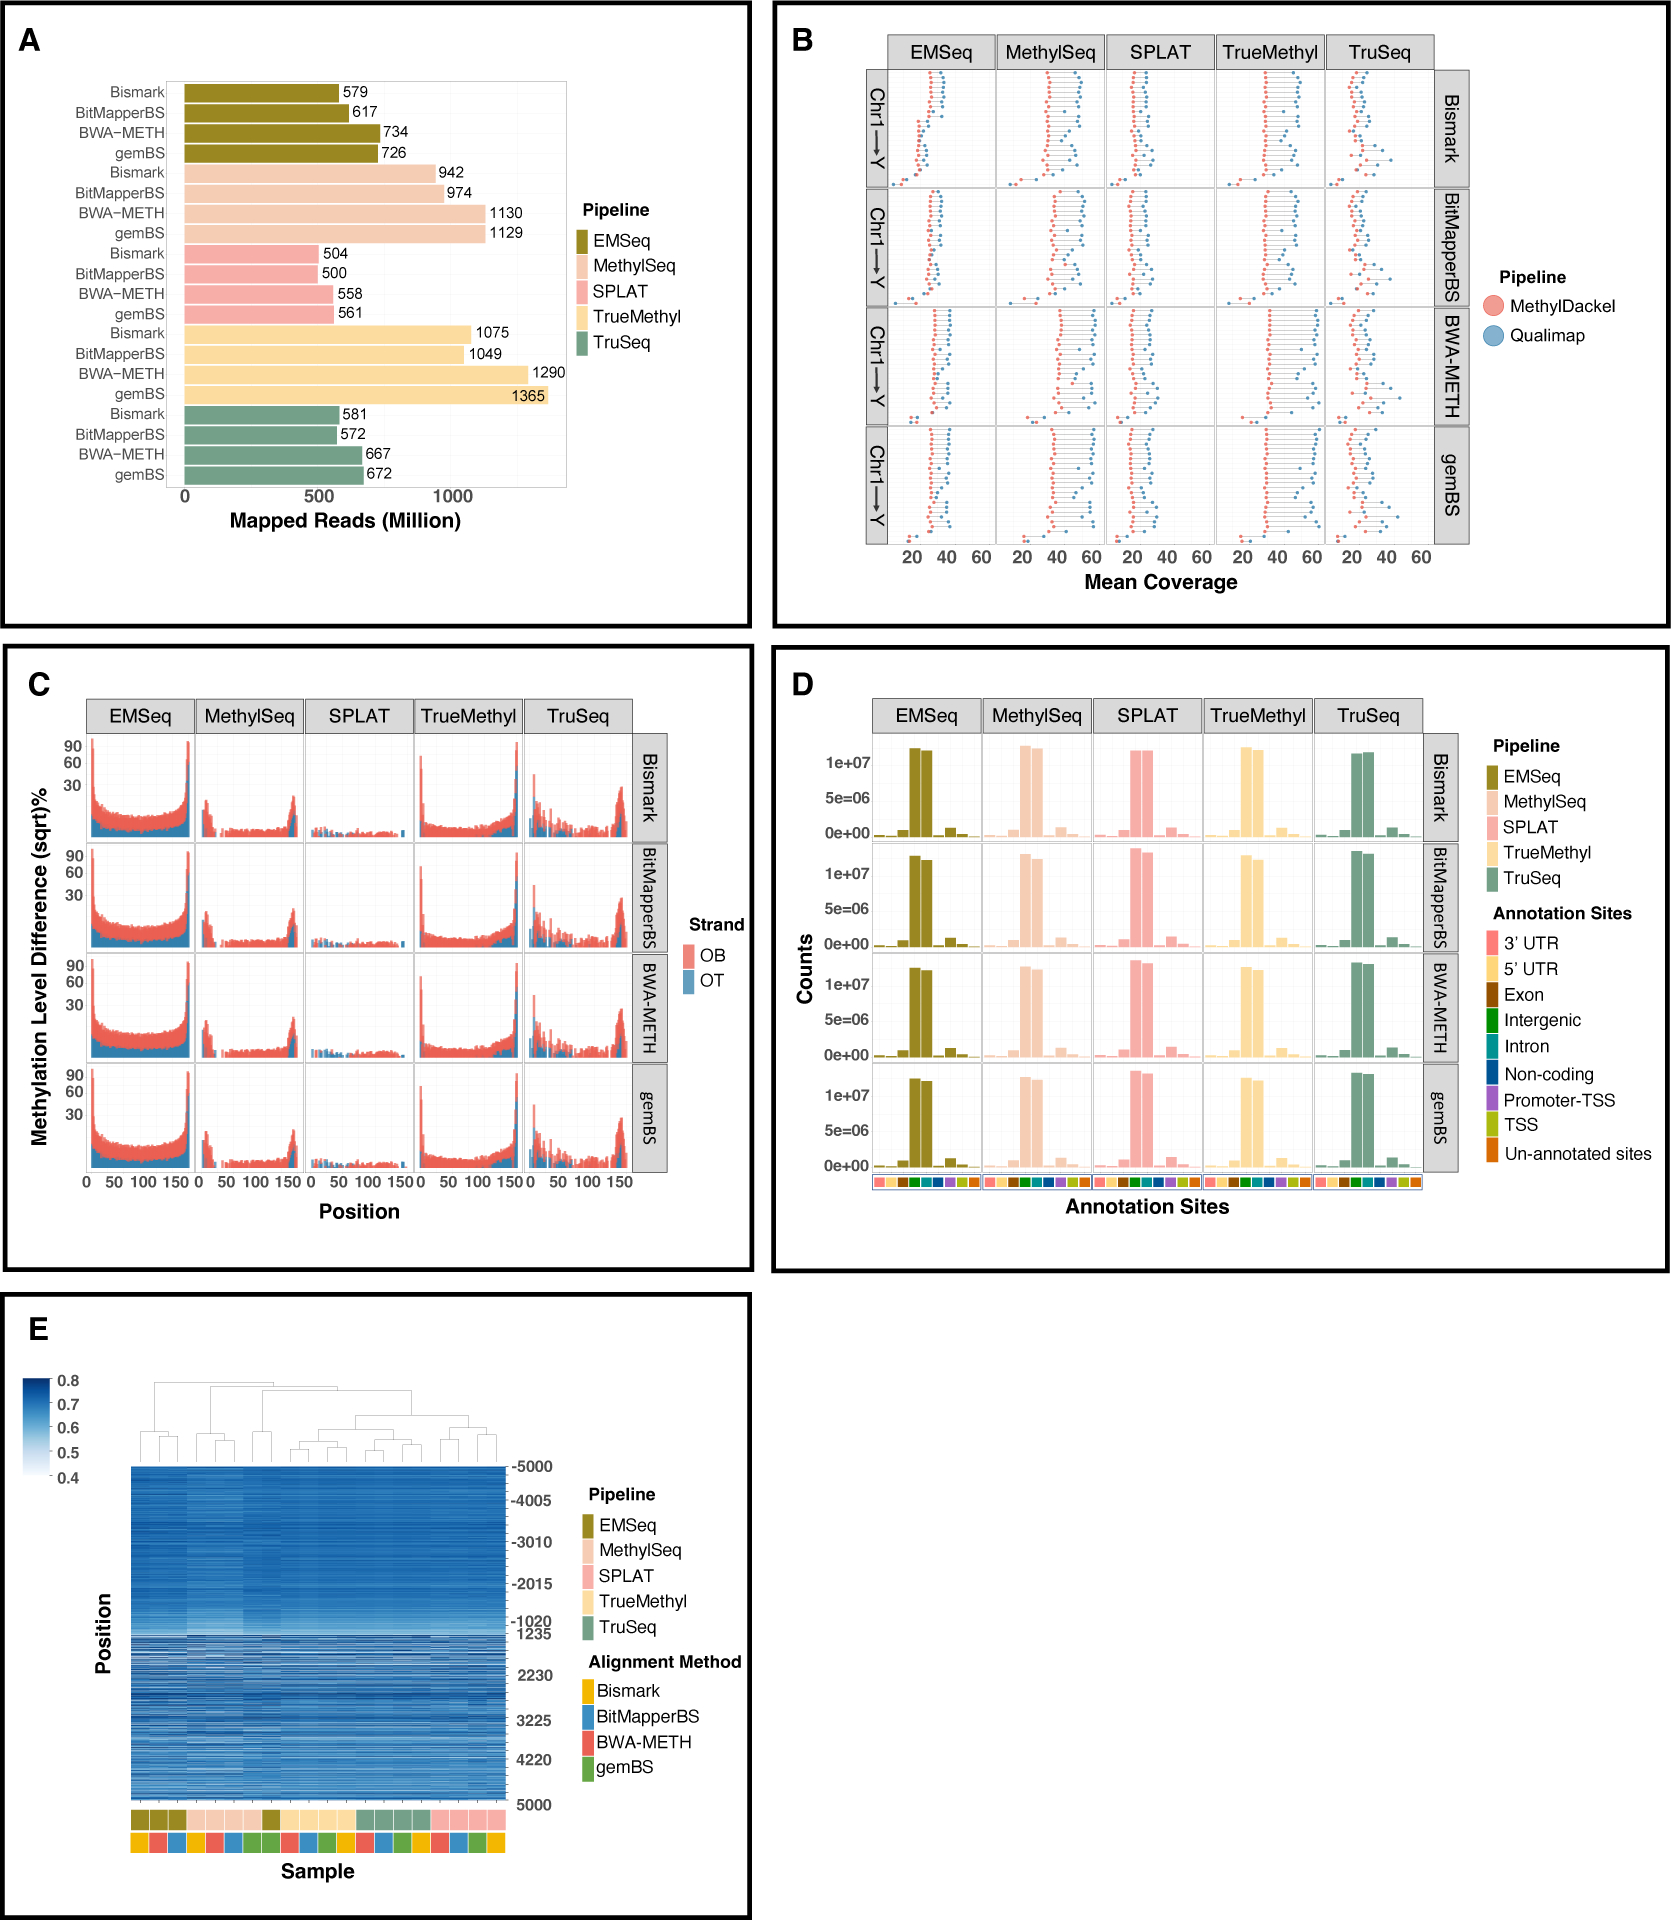
Figure 3. Mapping quality comparison across four alignment algorithms.

A. Mapping rates of four alignment methods throughout five library preparations. B. Post-alignment quality control measured by Qualimap and MethylDackel. C. Methylation bias (M-bias) plots of original top and bottom strands. D. Annotated regions across the reference genome generated from each alignment algorithm. E. Heatmap displaying the mean methylation percentage levels 5 kb upstream/downstream of transcription start sites (TSS).
