
Figure 4. Correlation matrix of genome-wide methylation levels for all CpG sites.
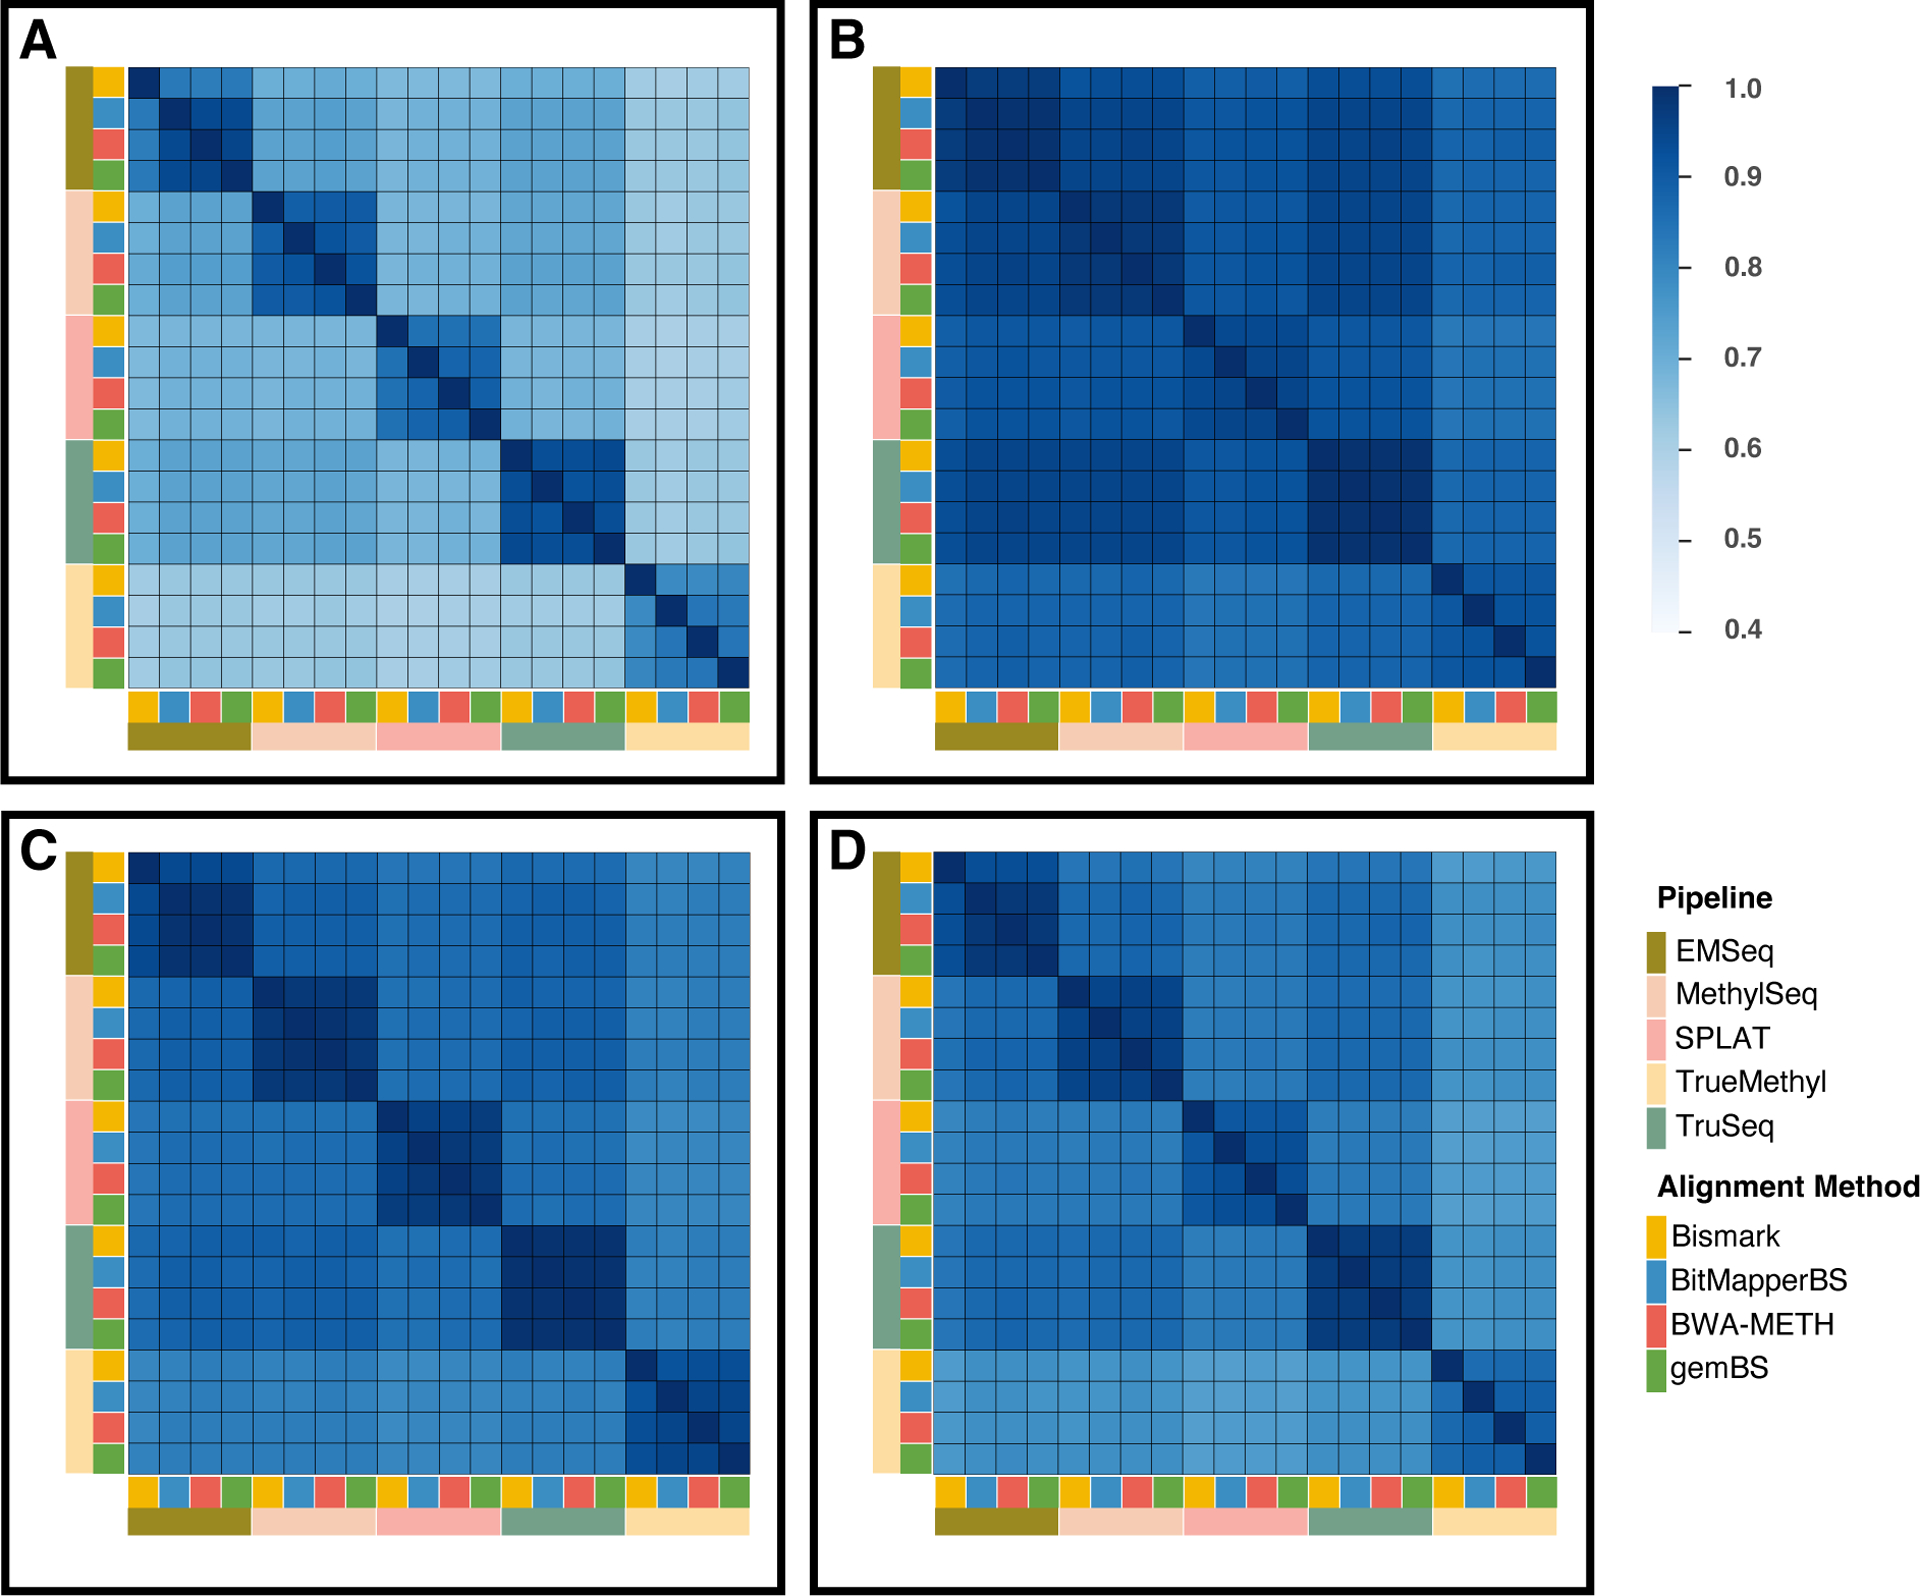
A-D represents Kendall rank correlation, Pearson correlation, Sheppard’s correction, and Spearman’s rank correlation, respectively. The overall correlation trends among the four statistical methods was similar; however, Kendall correlations showed notably lower correlation levels than the other three methods. The widely used Pearson correlation displayed higher correlation levels than Spearman’s method, which may be due to the inclusion of potential outliers.