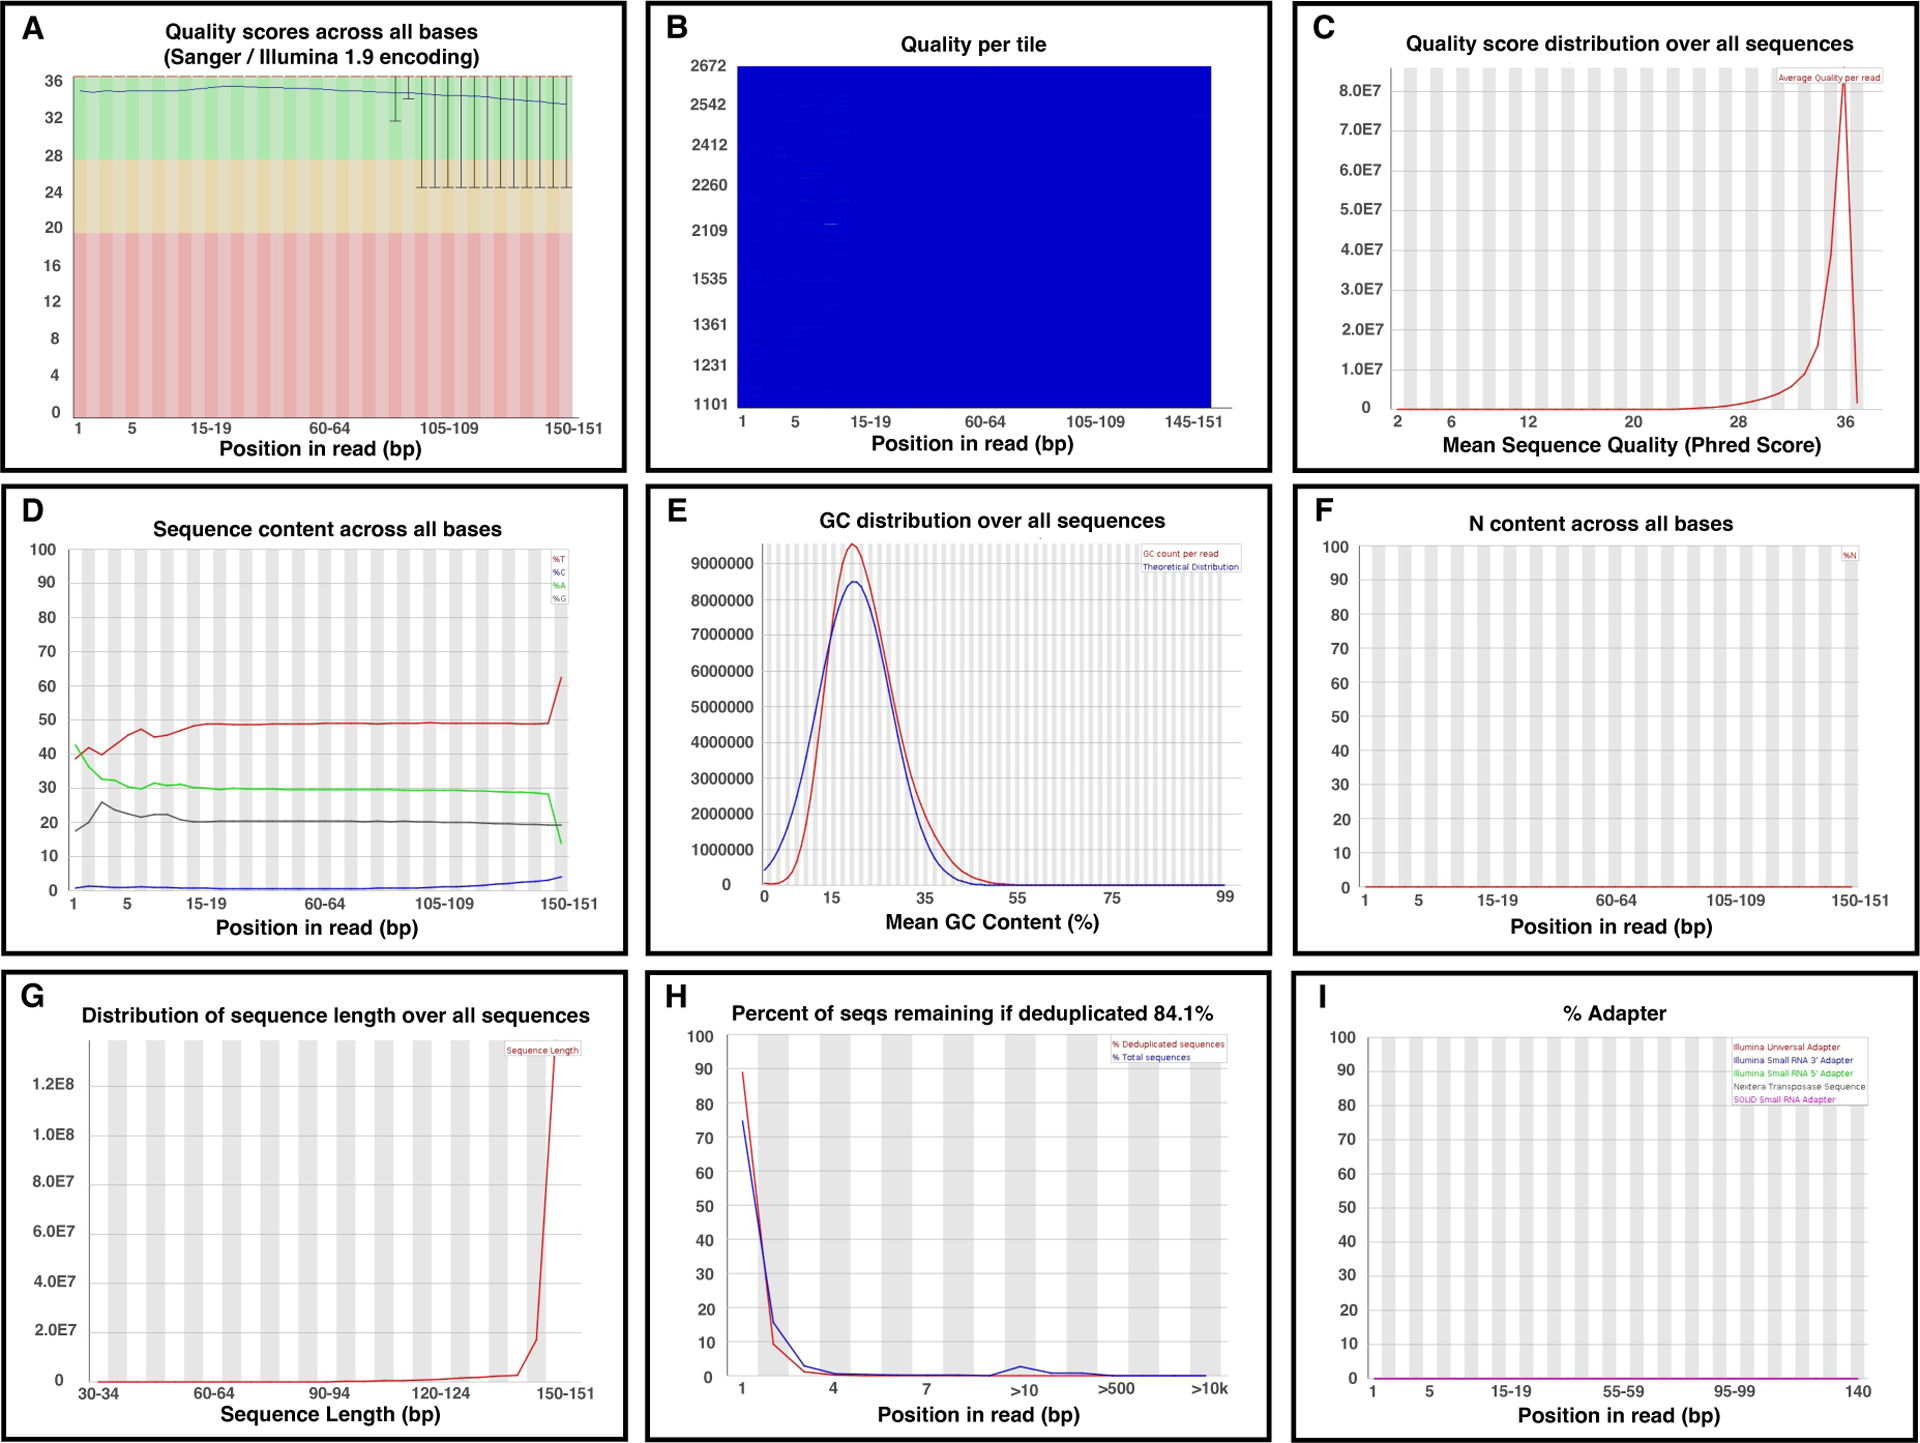
Figure 6. Quality control report of FastQC.

A. Per-base sequence quality. The boxplot shows the Phred quality scores across all read bases at each position in the input FASTQ file. The x-axis and y-axis represent the position of the reads and the quality score, respectively. The background colors categorize the quality into three levels: good quality (green), acceptable quality (yellow), and poor quality (red). Reduced quality calls are normally observed at the end of a read. The reads were qualified if the median for any base was ≥ 20 or the lower quartile for any base was ≥ 5. B. The per-tile sequence quality heat map is specific to Illumina libraries. Illumina maintains the original sequence identifiers, which allows quality checks of the encoded flowcell tiles of the reads. The cold (blue) and hot (red) colors indicate equal to or above average qualities of the running bases and below average qualities, respectively. Warnings are commonly observed in this part of the WGBS read. It is acceptable if the hotter colors are confined to a few specific areas and only impact a small range of tiles for limited cycles. The entire plot was blue. C. Per sequence quality scores provide an overview of the subset quality scores. This distribution is consistent with the per-base sequence quality boxplot. D. Per base sequence content plots the proportion of the four bases at each read position. The lines are parallel in eligible DNA sequencing, and the difference between the four bases is below 20% at all positions. However, a close-to-zero line of Cs and an overflow line of Ts is typically observed in WGBS data because the bisulfite conversion reduces read complexity. E. The per-sequence GC content compares the GC content distribution across the full input sequence reads to normal GC content distribution. However, methylated DNA shows skewed GC content due to bisulfite conversion. F. Per base N content is the percentage of bases with no base call (N) at each read position. A peaked N distribution suggests that the sequencer lacks confidence in deciding a valid base, which should be trimmed prior to alignment. G. WGBS data generated fragments of uniform length. The fragment size is the total length of the insert size and adapter. TruSeq libraries have short insert sizes causing increased vulnerability to adapter contamination and data loss. The sequence length had a mono-peak distribution. H. Sequence duplication level. Low and high duplication levels suggest high sequence coverage and low starting DNA quantity or PCR over-amplification, respectively. I. Adapter lines should be flat to zero; otherwise, adapter trimming is required in the next step.
