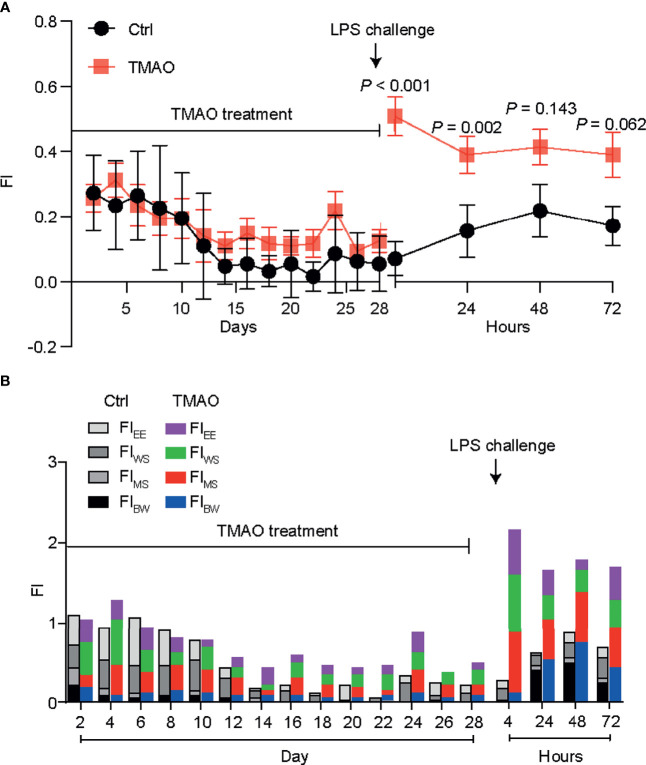
Figure 1.
(A) Changes in the frailty index in the TMAO-induced frailty model. Mice were treated with TMAO for 28 days then subjected to LPS challenge for 72h. The frailty index is based on four behavioral tests. Control group (black line), TMAO group (red line). (B) Changes in four indicators that measure changes in frailty index. Values are presented as mean ± SEM of 8 mice per group.

