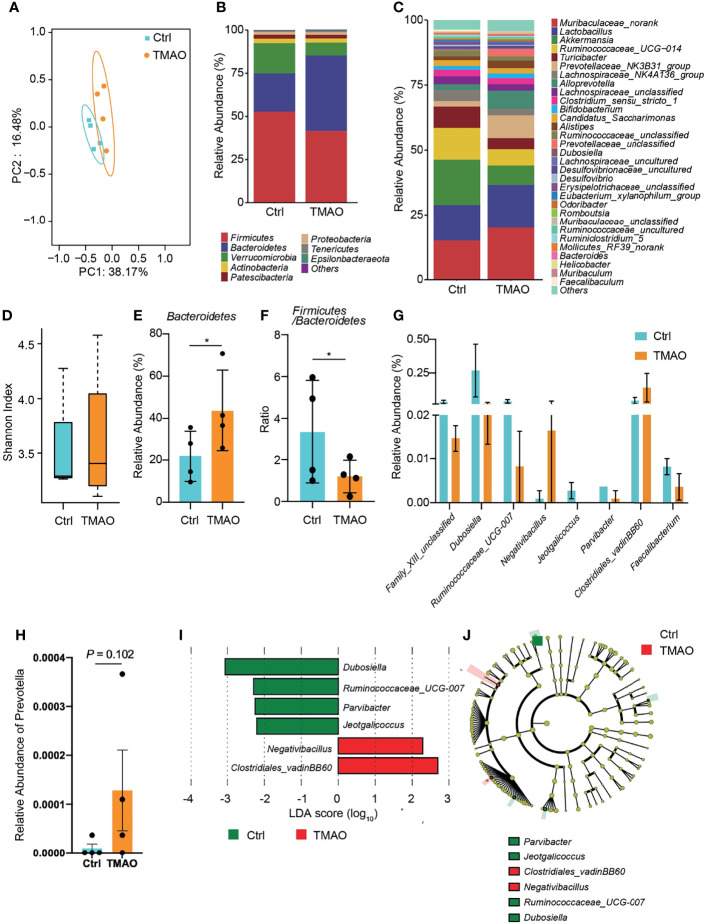
Figure 3.
Changes in the gut microbiota in the TMAO-induced frailty model. Fecal samples were collected after 4-week administration of TMAO. (A) Graphic PCoA for the control group (blue squares) and TMAO group (orange squares) at the operational taxonomic unit (OTU) level. (B) Average relative abundance of prevalent microbiota at the family level in the control and TMAO groups. (C) Average relative abundance of prevalent microbiota at the genus level in the control and TMAO groups. (D) Shannon indices of alpha-diversity of the gut microbiota in the control group (blue squares) and TMAO group (orange squares). (E) Relative abundance of Bacteroidetes, expressed as (%), was significantly lower in the control group (blue) than TMAO group (orange). (F) The Firmicutes/Bacteroidetes ratio was lower in the TMAO group (orange) than control group (blue). (G) Boxplot of the top eight differentially enriched genera in the control group (blue) and TMAO (orange) group. (H) Relative abundance of Prevotella was increased in the TMAO group (orange) than in the control group (blue) (I) LEfSe analysis showing bacterial taxa with significantly different abundances between the control and TMAO group. Green (red) indicates increased (decreased) abundance in the control group. (J) Taxonomic cladogram obtained from LEfSe analysis showing the distribution of bacterial taxa (phylum, class, and order) that were differentially abundant in the control and TMAO groups. Green (red) squares indicate increased abundance (decreased) in the control group. *p <0.05, Wilcoxon rank-sum test.

