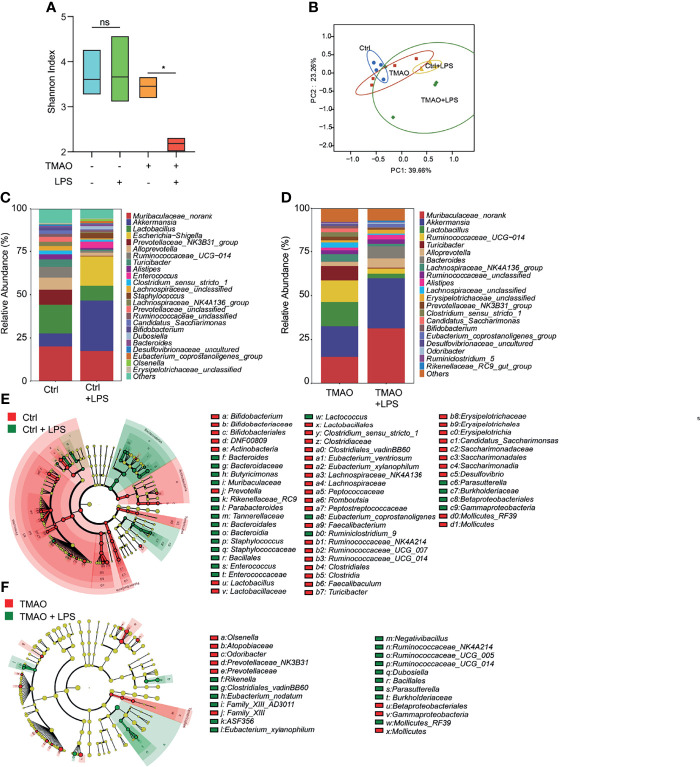
Figure 4.
Changes in the gut microbiota after LPS challenge in the TMAO-induced frailty model. Serum samples were collected after 4-week administration of TMAO or 72 h after LPS challenge. (A) Shannon indices of gut microbiota alpha-diversity in the control (blue), control + LPS (green), TMAO (orange), and TMAO + LPS (red) groups. (B) Graphic PCoA of the control (blue dots), control + LPS (yellow triangles), TMAO (red squares), and TMAO + LPS groups (green diamonds) at the OTU level. (C) Average relative abundance of prevalent microbiota at the genus level in the control and control + LPS groups. (D) Average relative abundance of prevalent microbiota at the genus level in the TMAO and TMAO + LPS groups. (E) Taxonomic cladogram obtained from LEfSe analysis showing the distribution of bacterial taxa (phylum, class, and order) that were differentially abundant in the control and control + LPS groups. Green (red) indicates increased abundance in the control group (control + LPS group). (F) Taxonomic cladogram obtained from LEfSe analysis showing the distribution of bacterial taxa (phylum, class, and order) that were differentially abundant in the TMAO and TMAO + LPS groups. Green (red) indicates increased abundance in the TMAO group (TMAO + LPS group). *p <0.05, Ns indicates not significant, Wilcoxon rank-sum test.

