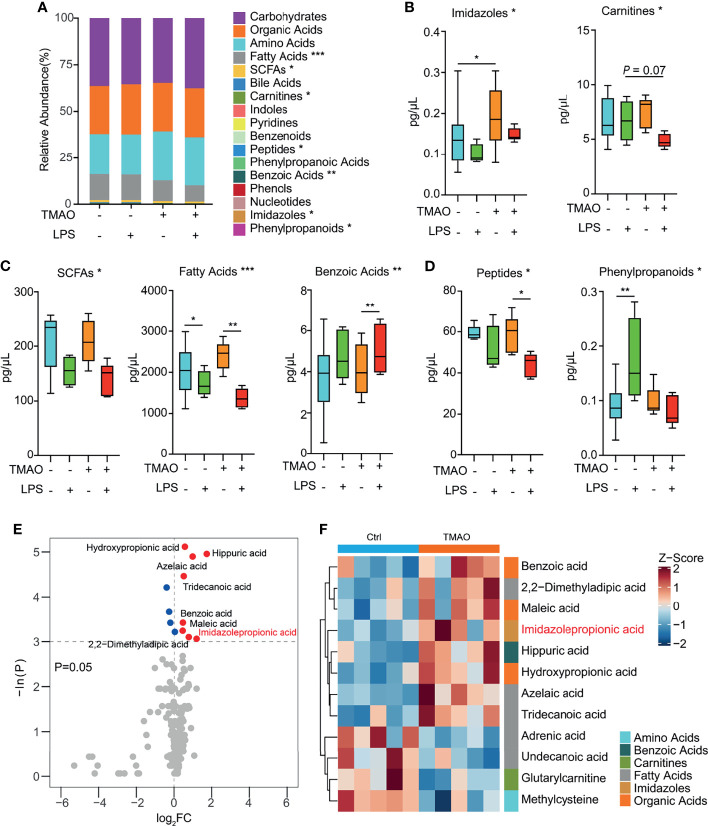
Figure 5.
Changes in serum metabolites after LPS challenge in the TMAO-induced frailty model. (A) Average quantitative abundance of serum metabolites in the control, control + LPS, TMAO, and TMAO + LPS groups. (B) TMAO significantly induced imidazoles and carnitines. (C) The stress response to LPS significantly induced SCFAs, fatty acids, benzoic acids, and (D) differently altered peptides and phenylpropanoids. (E) Volcano map showing the differential metabolites identified by unidimensional statistical analysis. Metabolites colored blue (red) were reduced (increased) in the TMAO group compared to the control group. (F) Heatmap of the top 12 differently altered serum metabolites in individual mice, showing that the differences in the metabolite levels were associated with the experimental groups. *p <0.05, **p <0.01, ***p <0.005, Wilcoxon rank-sum test.

