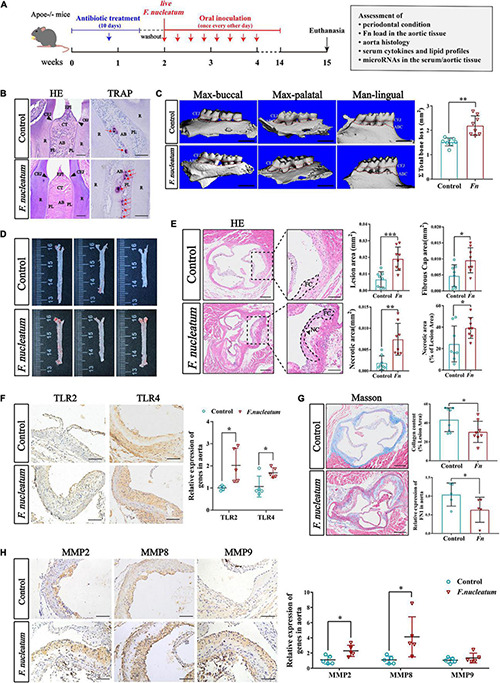
FIGURE 1.

Evaluation of periodontal condition and atherogenesis induced by oral F. nucleatum infection. (A) The animal experimental setup. (B) H&E staining and TRAP staining indicated the interproximal areas between the first and second mandible molars. The red arrows revealed TRAP-positive multinucleated osteoclasts. CEJ, cementum-enamel junction; CT, connective tissue; R, root; EPI, oral epithelium; PL, periodontal ligament; AB, alveolar bone. Scale bars, 100 μm. (C) The images show the reconstructed three-dimensional images from the computerized tomography of the right maxilla buccal, maxilla palatal, and mandible lingual sides. More bone loss and root bifurcation exposure could be observed in the infected group compared with the control group. Scale bar, 1 mm. The area between the cemento-enamel junction (CEJ) and the alveolar bone crest (ABC) of molars 1, 2, and 3 of maxilla palatal, maxilla buccal, and mandible lingual sides was measured to calculate the total ABR. The infected group had statistically increased alveolar bone resorption relative to the control group (n = 8, each group). (D) Atherosclerotic lesion areas in en face aortas were assessed by Oil Red O staining. (E) The left panels showed the representative histological analysis of aortic sinus cross-sections stained with H&E. Scale bars, 200 μm. Enlarged images from the black-framed areas in the right panels revealed how the necrotic core area and fibrous cap were defined for quantification in each section. Dashed lines show the boundary of the developing necrotic core (NC) and fibrous cap (FC). The black arrow showed the cholesterol crystals in plaques. Scale bars, 100 μm. Scatterplots are the mean lesion area calculated from aortic sinus H&E cross-sections as well as the quantification of the necrotic core area and fibrous cap. Each dot represents the mean of the quantification of five sections from an individual animal (n = 8, each group). (F) Immunohistochemistry staining of TLR2 and TLR4 proteins; Scale bars, 100 μm. qRT-PCR analyze the relative mRNA levels of TLR2 and TLR4 in aortic tissues (n = 5, each group). (G) Masson staining shows the representative aortic sinus cross–sectional analysis of collagen content. Scale bars, 200 μm. Scatterplots exhibit quantifications of collagen content expressed as the average percentage of collagen per total lesion area. (n = 8, each group). (H) Immunohistochemistry staining of matrix metalloproteinases (MMP2, MMP8, and MMP9); Scale bars, 100 μm. Data are expressed as the relative mRNA levels of the matrix metalloproteinases in the aortic tissues (n = 5, each group). All data represent the mean ± SD. *p < 0.05, **p < 0.01, ***p < 0.001 vs. control group Student’s t-test.
