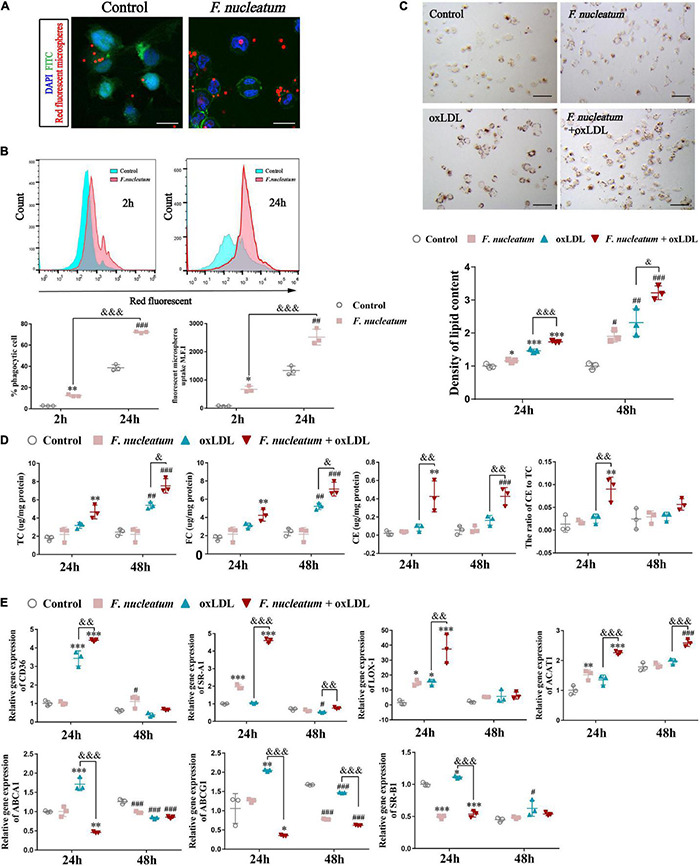
FIGURE 6.

F. nucleatum promotes macrophage phagocytosis and foam cell formation. (A) Representative confocal microscopy image exhibited the engulfment of fluorescent microspheres by macrophages for 2 h. F. nucleatum group, after 24 h infection. control group, uninfected. Scale bars, 25 μm. (B) Flow cytometry analysis of 2 h fluorescent microspheres (50:1) uptake in macrophages after infection with F. nucleatum for 2 and 24 h at 37°C. The results were expressed as a percentage of positive phagocytosis and geometric mean fluorescence intensity (M.F.I.) after subtracting the autofluorescence of cells incubated in the absence of fluorescent microspheres. (C) Representative images of macrophages incubated with or without ox–LDL (50 μg/ml) for 24 h, then stained with ORO. Scale bars, 75 μm. The panel below shows the quantification of lipid droplets accumulated in the cytoplasm at 24 and 48 h, which were released using isopropyl alcohol and measured at 510 nm. Data were expressed as relative density to the control group. (D) Quantification of total cholesterol (TC), free cholesterol (FC), cholesterol esters (CE), and the ratio of CE to TC (CE/TC rate) in macrophages after treated as before. (E) The relative expression of genes involved in cholesterol metabolism after macrophages incubated with or without ox–LDL (50 μg/ml) for 24 and 48 h under infection/non-infection conditions. The fold change of mRNA was calculated relative to 24 h control group. Data represent the mean ± SD of three duplicates. *p < 0.05, **p < 0.01, ***p < 0.001, vs. control group (24 h); #p < 0.05, ##p < 0.01, ###p < 0.001 vs. control group (48 h); &p < 0.05, &&p < 0.01, &&&p < 0.001, comparison among groups; The one-way ANOVA with Tukey’s post-hoc tests.
