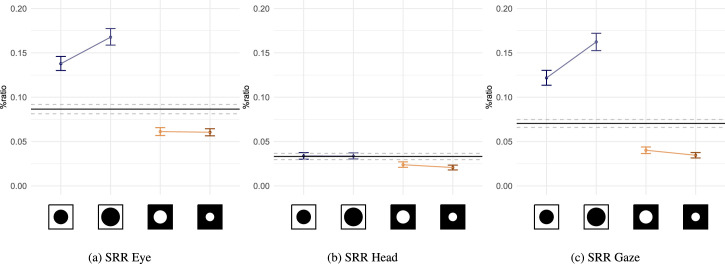
Figure A.6.
Average and 95% CI of saccadic reversal rates (SRR) of relative saccade direction calculated across subjects and stimuli. The axis labels have been replaced with icons representing mask types and radii, from left to right: central mask 6°, central 8°, peripheral 6°, peripheral 4°. The control condition is present as black lines crossing the plots horizontally (mean is shown as a solid black line, dashed lines report 95% CI).

