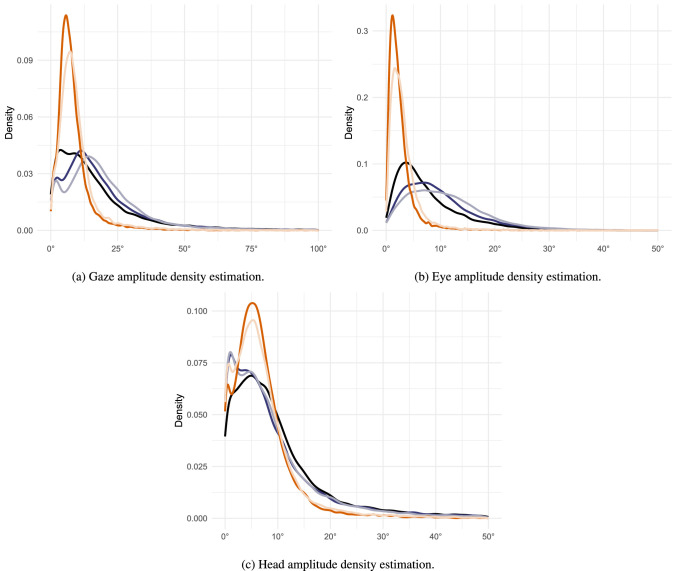
Figure A.7.
Figures A.7a, A.7b and A.7c show density estimations of saccade distributions as a function of gaze, eye and head movement amplitudes. Gaze movement amplitudes (Figure A.7a) are presented with a maxima of 100°. Colour legend:  no-mask,
  central 6°,
  central 8°,
  peripheral 6°, and
  peripheral 4°.

