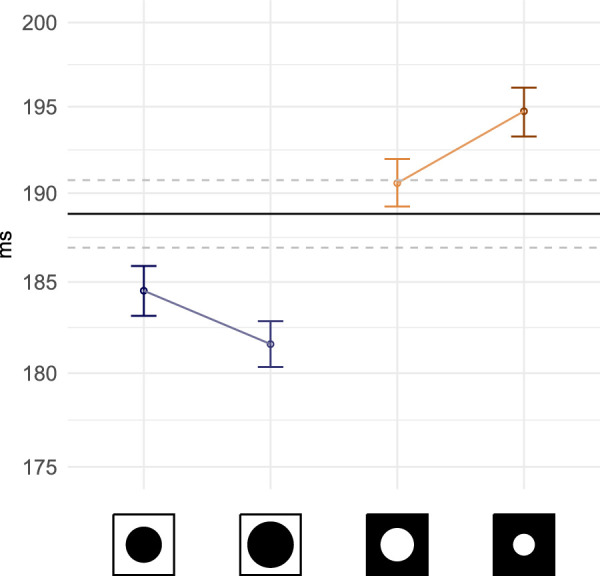
Figure 4.

Average and 95% CI of fixation durations calculated across subjects and stimuli (on a log-scale). The axis labels have been replaced with icons representing mask types and radii, from left to right: central mask 6°, central 8°, peripheral 6°, peripheral 4°. Mask conditions are ordered by increasing surface masked. The control condition is present as a black line crossing the plots horizontally (mean is shown as a solid black line, dashed lines report 95% CI).
