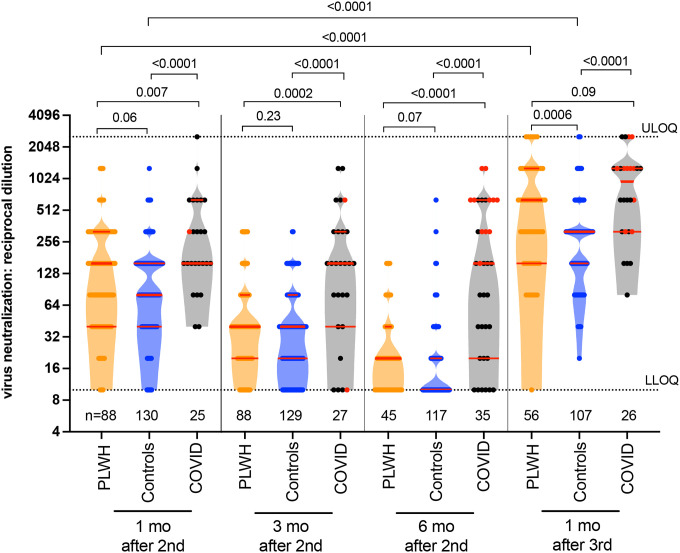
Figure 2. Live virus neutralization activities following two and three COVID-19 vaccine doses.
Viral neutralization activity in plasma at one, three and six months following the second dose, and one month following the third vaccine dose, in PLWH (orange) and controls (blue) who were COVID-19 naive at the studied time point, as well as individuals who had recovered from COVID-19 at the studied time point (COVID group, black). Plasma neutralization was defined as the reciprocal of the highest plasma dilution at which vial cytopathic effect was prevented in all triplicate assay wells. Plasma samples showing neutralization in fewer than three wells at the lowest plasma dilution of 1/20 were coded as having a reciprocal dilution of 10, corresponding to the lower limit of quantification (LLOQ) in this assay. The highest dilution tested was 1/2560, which corresponds to the upper limit of quantification (ULOQ). Participants who experienced a post-vaccination infection were relocated from their original group into the COVID19 group at their first post-infection study visit, where they are denoted by a red symbol. Participant Ns are shown at the bottom of the plot. The thick horizontal red bar represents the median; thinner horizontal red bars represent the IQR. P-values were computed using the Mann-Whitney U-test (for comparisons between groups) or the Wilcoxon matched pairs test (for comparisons across time points within a group) and are uncorrected for multiple comparisons.

