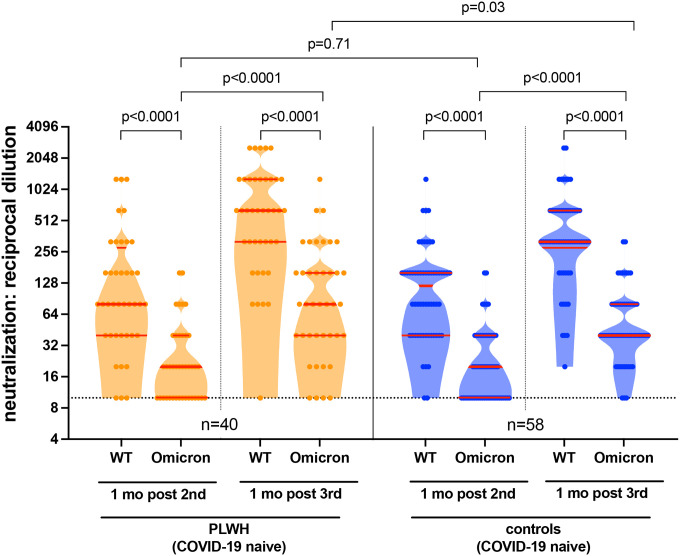
Figure 4: Anti-Omicron neutralization activities one month after the second and third COVID-19 vaccine doses.
Neutralization activities, reported as the reciprocal of the highest plasma dilution at which neutralization was observed in all triplicate assay wells, against the wild-type (WT) and Omicron (OM) virus isolates a subset of PLWH (orange) and controls (blue) who remained COVID-19 naive throughout the study. Participant Ns are shown at the bottom of the plot. Thick horizontal red bar represents the median; thinner horizontal red bars represent the IQR. P-values were computed using the Wilcoxon matched pairs test (for within-group comparisons) or the Mann-Whitney U-test (for between-group comparisons) and are uncorrected for multiple comparisons.

