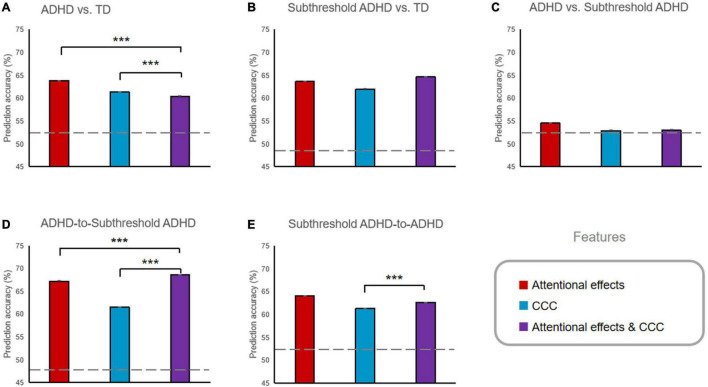
FIGURE 3.
Prediction accuracy of the classification analyses using different features. (A) ADHD vs. TD classification. (B) Subthreshold ADHD vs. TD classification. (C) ADHD vs. Subthreshold ADHD classification. (D) ADHD-to-Subthreshold ADHD cross-classification. (E) Subthreshold ADHD-to-ADHD cross classification. ***p < 0.001. Error bars indicate the standard error of the mean, which were very minimal compared to the mean. Prediction accuracies of all ADHD vs. TD and Subthreshold ADHD vs. TD classification, and all cross-classifications were significantly higher than the chance level (represented by the dashed lines, all ps < 0.001).

