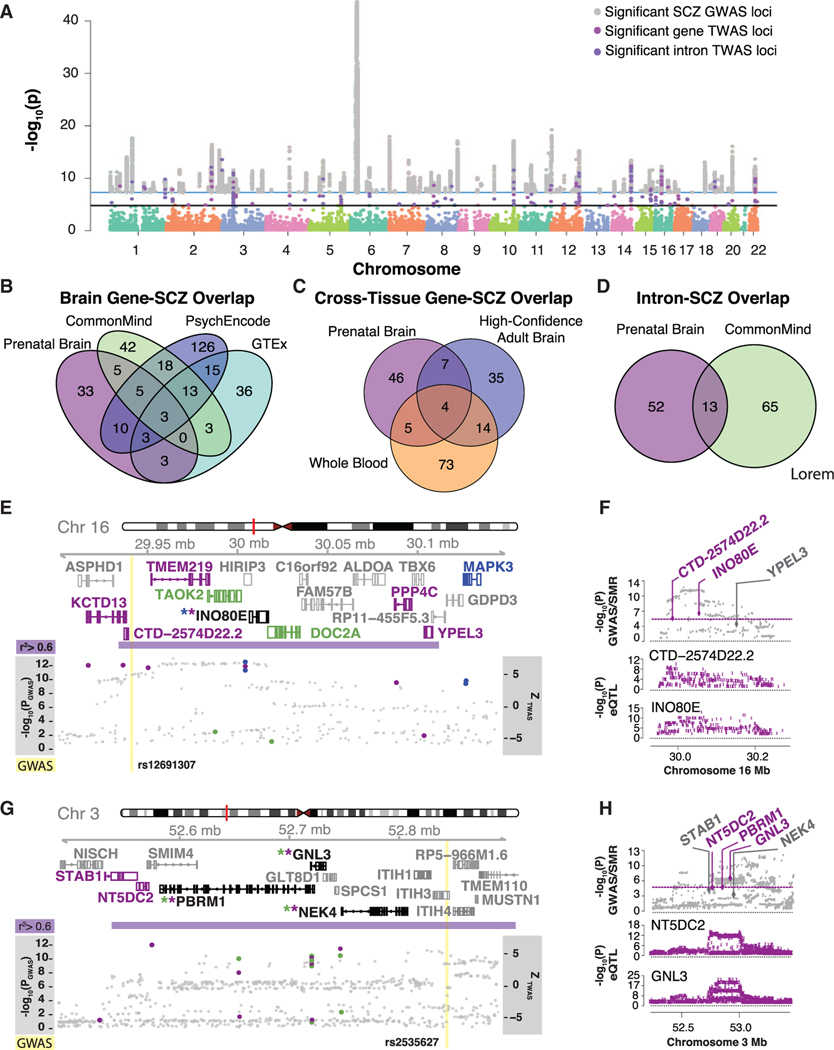
Figure 6. SCZ TWAS.
(A) Manhattan plot ofTWAS resultsfrom genes and intron SCZ associations, highlighting the 62 genes and 91 introns significant at Pbonferroni < 0.05, overlaid with the SCZ GWAS significant loci. Key depicts significant GWAS loci (gray), TWAS genes (magenta), and introns (purple).
(B) Overlap of TWAS-significant genes from prenatal brain, adult brain GTEx, adult brain CMC, and adult brain PsychENCODE.
(C) Overlap ofTWAS genes from prenatal brain, high-confident adult brain, and whole-blood.
(D) Overlap ofTWAS introns from prenatal brain and adult brain.
(E and G) Illustration of two genomic regions on chromosome 16 (E) and on chromosome 3 (G) harboring at least one prenatal TWAS loci. The y axis shows Ensembl gene ID, LD, TWAS results overlapped with GWAS loci –log10(P); prenatal brain TWAS genes and introns are magenta dots, high-confident adult brain TWAS genes are blue dots, adult brain TWAS introns are green dots, and GWAS SNPs are gray dots) and SCZ GWAS loci (yellow line). Ensembl gene names and gene modelsare colored by significance in datasets; prenatal brain geneand intron associations(magenta), adult brain intron associations(green), high-confident adult brain gene associations(blue). Ifagene is significant in both prenatal and adult it is blackwith an asterisk colored bythedataset. SCZ GWAS loci are shown in yellow, with the LD block surrounding the SCZ locus in purple defined by r2 > 0.6.
(F and H) Summary data-based Mendelian randomization of prenatal brain genes with SCZ GWAS (F corresponds to the genomic region in E and H corresponds to the genomic region in G). Theyaxis shows – log10(P) ofSMR and GWAS loci and individual gene eQTL – log10(P). Genes are colored by passing the 5% FDR threshold for PSMR.

