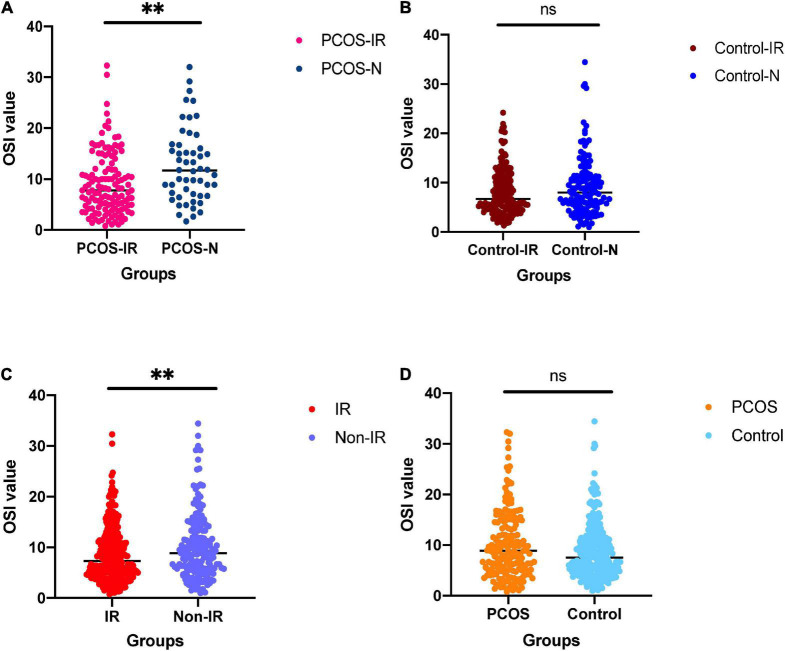
FIGURE 1.
(A) For comparison of ovarian sensitivity index (OSI) between polycystic ovary syndrome (PCOS)-insulin resistance (IR) groups and PCOS-N group. (B) For comparison of OSI between the control-IR group and control-N group. (C) For comparison of OSI between IR group and normal group. (D) For comparison of OSI between PCOS group and control group. nsnot significant; ∗∗p < 0.01.

