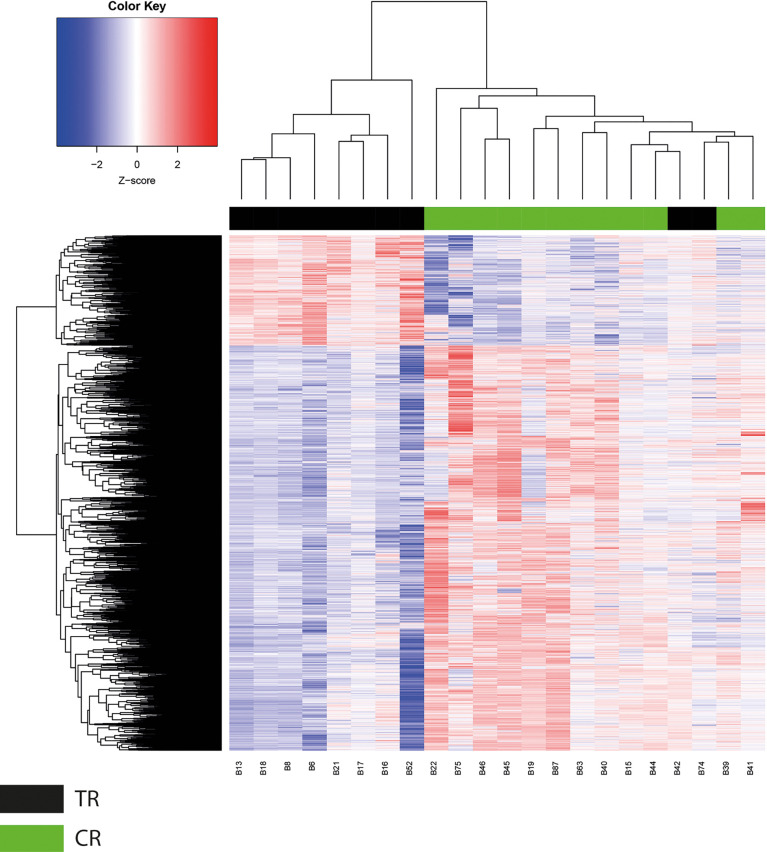
Figure 1.
Global methylation analysis. Unsupervised clustering analysis of 16,538 CpG regions differentially methylated between therapy resistance (TR) and complete response (CR) tumors. Red color regions represent high levels of methylation (Z score from 0 to 2), and blue color regions represent low methylation status (Z score from 0 to −2).

