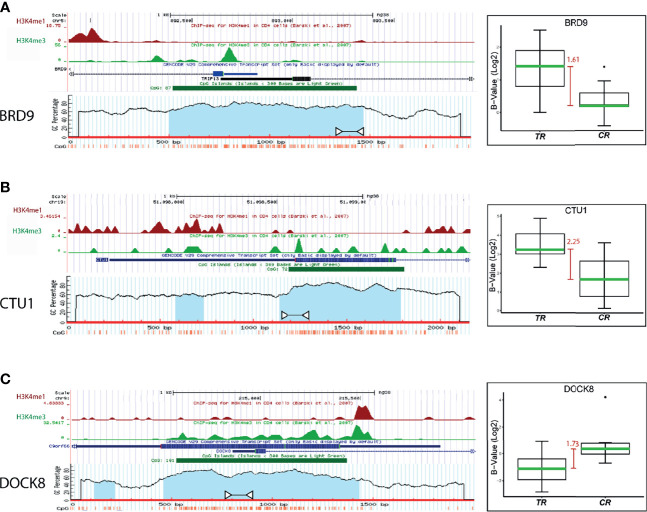
Figure 3.
Analysis of the promoter regions of (A) BRD9, (B) CTU1, and (C) DOCK8 genes. Blue bar represents the promoter region of each gene, the green bar points the CpG island location, and the blue shadow color indicates the CpG density of the island. White arrows indicate the amplification region for the MSP validation. The boxplot shows the median difference (MD, red bars) between TR and CR samples methylation levels from each promoter region.

