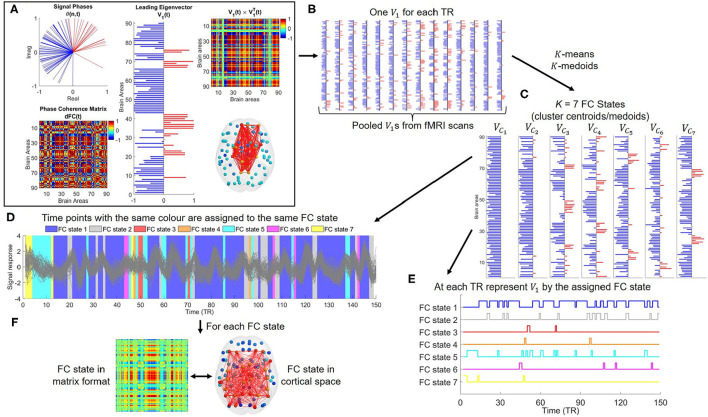
Figure 1.
Graphical illustration of the estimation and characterization of the temporal trajectories of recurrent FC states obtained by using Leading Eigenvector Dynamics Analysis (LEiDA). (A) Phases of all N = 90 brain areas in the complex plane at time t (top left); Phase coherence matrix at time t, dFC(t) (bottom left); Vector representation of the leading eigenvector, V1(t), of dFC(t) (middle); Matrix representation of V1(t) (top right); Network representation of V1(t), with links between the areas with positive elements in V1(t) plotted in red (bottom right). (B) The leading eigenvectors are computed for each time point and from all fMRI scans. (C) The pooled leading eigenvectors are partitioned into K clusters using a clustering algorithm. The cluster centroids/medoids are assumed to represent recurrent patterns of phase coherence (FC states). (D,E) The leading eigenvector at each TR is represented by the centroid/medoid of the cluster to which it was assigned by the clustering procedure. This originates time courses of FC states for each fMRI session. The time courses are then characterized using tools from dynamical systems theory. (F) Each FC state can be represented as a N × N matrix (outer product) and as a network in cortical space (elements with positive sign linked by red edges).

