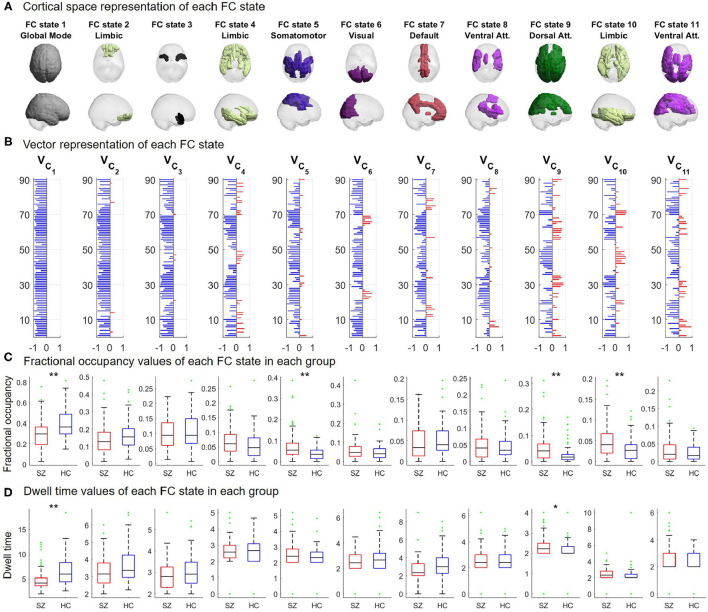
Figure 4.
Repertoire of FC states defined from phase coherence obtained from the clustering solution with K = 11 clusters. The FC states are arranged (left-to-right) according to decreasing estimated fractional occupancy. Each FC state is represented by a N × 1 centroid VCα, with α∈{1, …, 11}. (A) Cortical rendering of all brain areas with positive values in VCα. The functional network defined by Thomas Yeo et al. (2011) with which VCα most significantly overlapped is indicated as subtitle. (B) Vector representation showing the N elements in VCα, representing the contribution of each brain area to FC state α. (C) Boxplot of the fractional occupancy values for each FC state for the SZ and HC groups. (D) Boxplot of the dwell time values for each FC state for the SZ and HC groups. Single and double asterisks indicate significant intergroup differences with p < α2 and p < α3 (one-tailed tests), respectively. Green points represent outliers, according to the Tukey criterion (Tukey, 1977).

