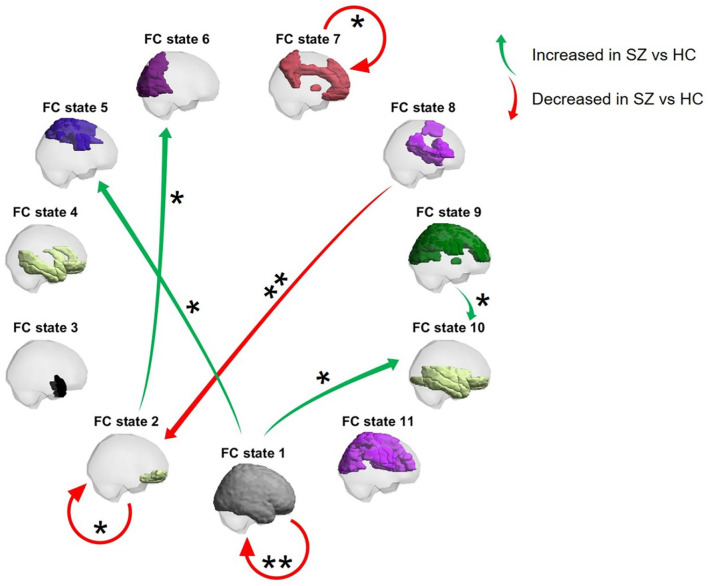
Figure 5.
Transition diagram of the state-to-state transitions significantly altered in SZ patients compared to HCs. Arrows represent a mean transition probability that was significantly increased (green) or decreased (red) in SZ patients compared to HCs. Single and double asterisks indicate, respectively, significant intergroup differences with p < 0.05/11 and p <0.05/(11 × 11) (one-tailed tests).

