
Fig. 8.
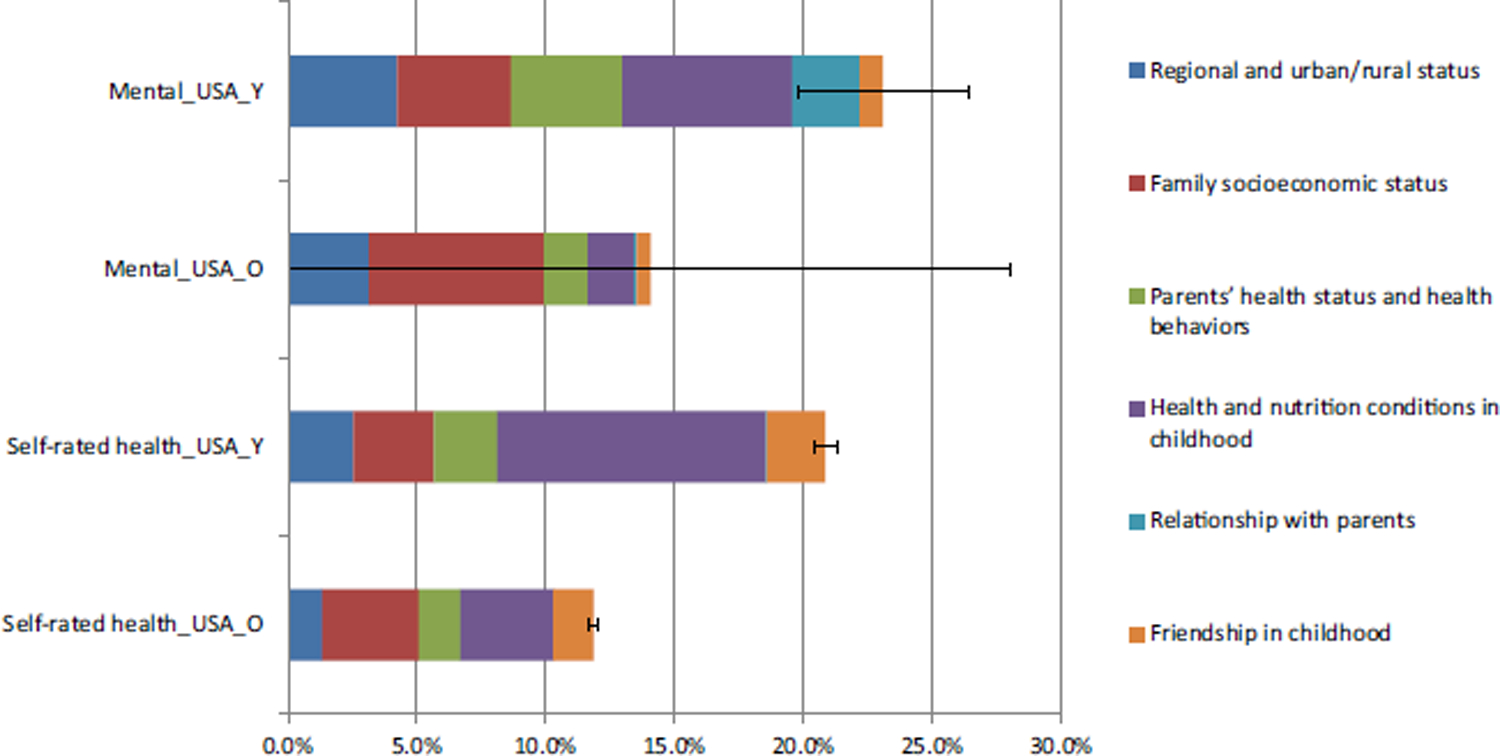
Robustness Checks Comparing Age Cohorts 50–64 and 65 + using the American Sample (Restricting to More Comparable Childhood Circumstances Defined in Table 2). Note: Y represents age cohort 50–64, O represents age cohort 65 +
Official websites use .gov
A
.gov website belongs to an official
government organization in the United States.
Secure .gov websites use HTTPS
A lock (
) or https:// means you've safely
connected to the .gov website. Share sensitive
information only on official, secure websites.
Robustness Checks Comparing Age Cohorts 50–64 and 65 + using the American Sample (Restricting to More Comparable Childhood Circumstances Defined in Table 2). Note: Y represents age cohort 50–64, O represents age cohort 65 +