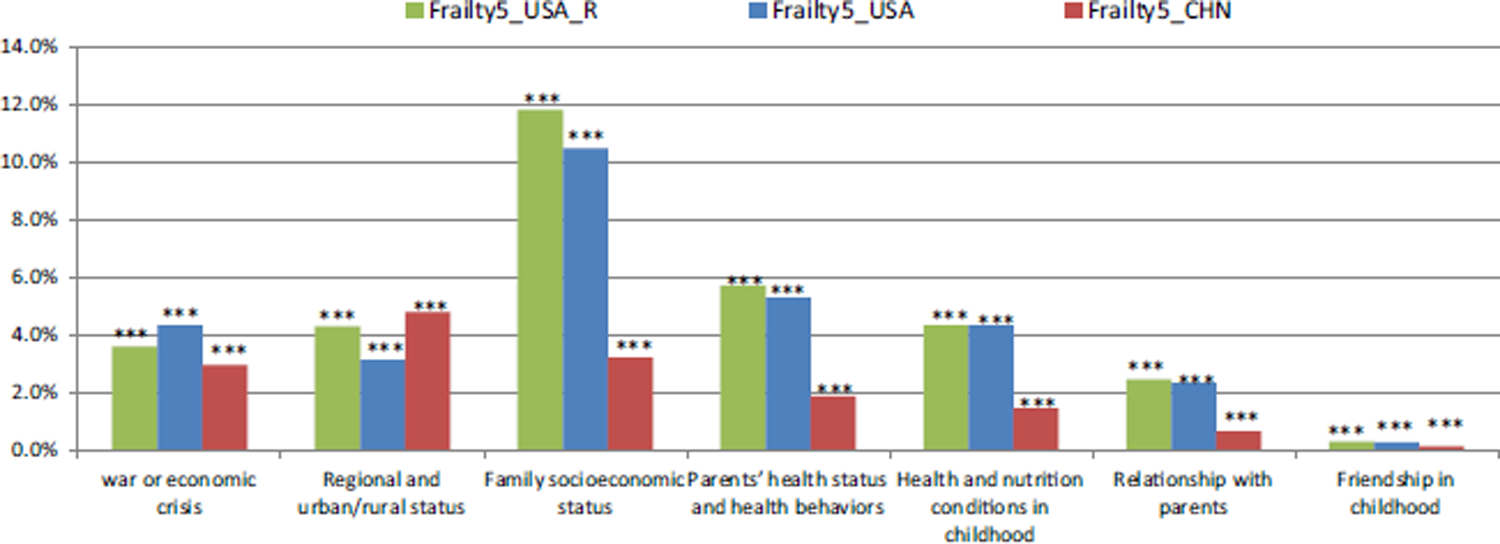
Fig. 9.

Robustness Checks Comparing Alternative Samples of the USA in physical health (the USA vs. China, age 65 +). Notes: ***p < 0.01. Frailty5_USA represents results using the sample in original submission with 2266 individuals who participated in at least one of the two waves of frailty tests. Frailty5_ USA_R represents results using the sample with 2075 individuals who participated in both waves of HRS frailty tests
