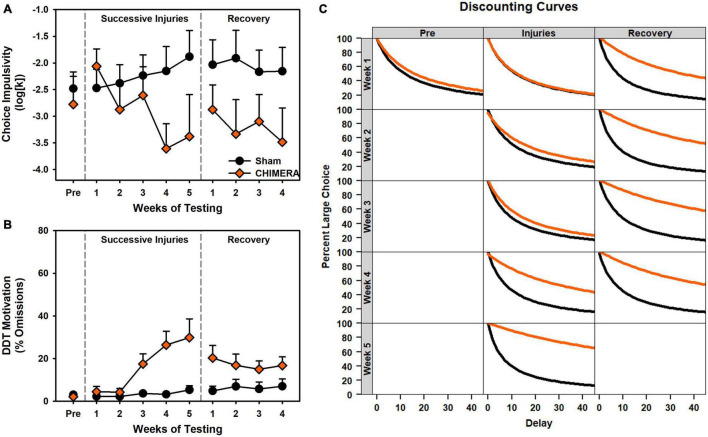
FIGURE 4.
Performance on the DDT during Experiment 2. (A) There was a significant decrease in k values over repeated injuries (p < 0.001) which persisted into the recovery period (p = 0.045). (B) There was a significant increase in omissions over repeated injuries (p < 0.001) which persisted into the recovery period (p = 0.027). (C) Curves of the fitted discounting data from the k value.

